My Price Action Indicator
My Price Action indicator is a simple tool for analyzing buying or selling pressure in the market. You can use the tool to manage open trades or use it as a trading strategy.
Description
Are you a price action trader but find it frantic to search for the right price action patterns? Your worries are over as the My Price Action Indicator for MT5 solves this problem for you. Let’s learn more about the indicator in this article.
What is My Price Action Indicator?
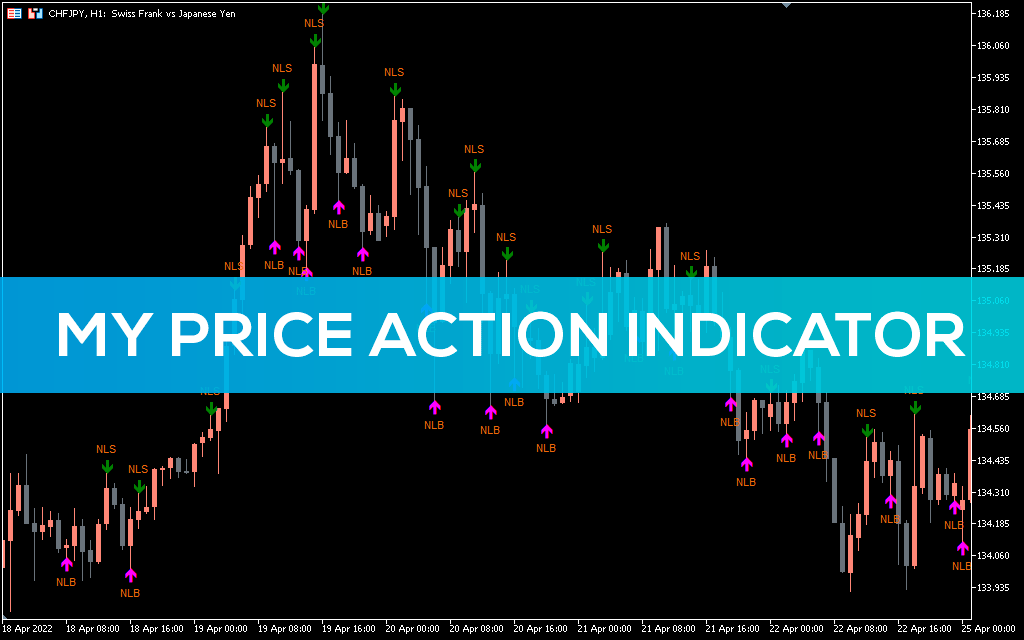
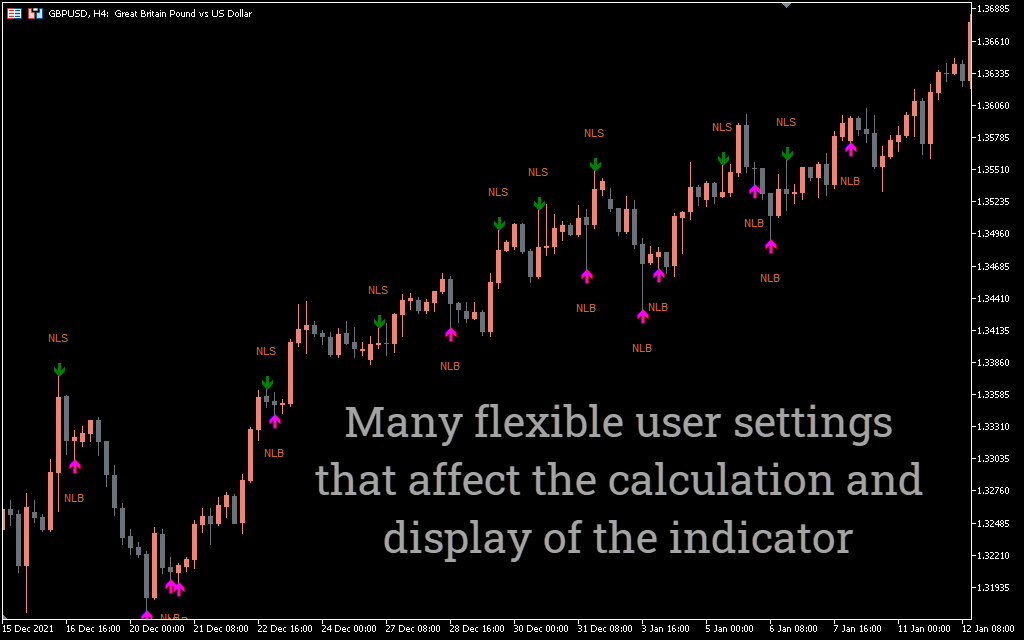
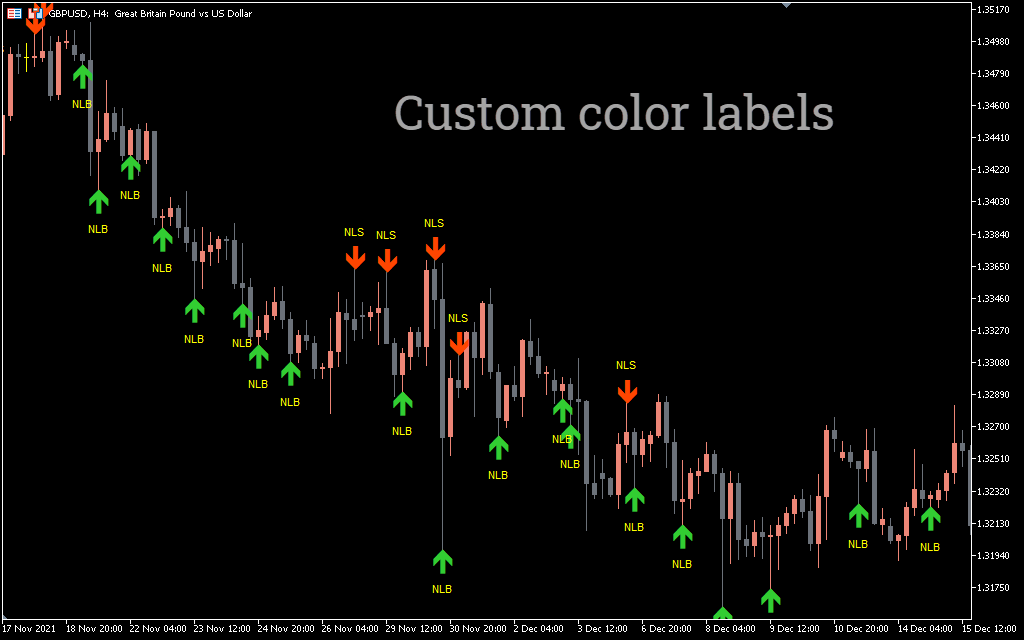
My Price Action is a custom indicator that indicates important candles where a significant price move is potentially expected. The indicator has different readings. First, it marks the arrows above or below the candles. The color of the arrows also indicates certain price action.
However, the arrow readings cannot be considered an independent buy or sell signal. Therefore, you may need to understand the various indications and their interpretation before using them in your trading.
How to use the indicator?
The key principle of the indicator is based on the shadow of the candles. You get a point when the candle has a lower or higher shadow. This makes it easier for you to look for buying or selling pressure in a particular case.
For example, you will find a long shadow on the underside. This means that buying pressure is growing. You can look for an opportunity in such a scenario for a long time.
My Price Action indicator trading strategies
Now let’s move on to the trading strategy of the indicator.
Buy setup
- Use a 4-hour timeframe.
- Put the hightwick1 value as 50 and the hightwick2 value as 25.
- Put the lowtwick1 value as 50 and lowtwick2 value as 25.
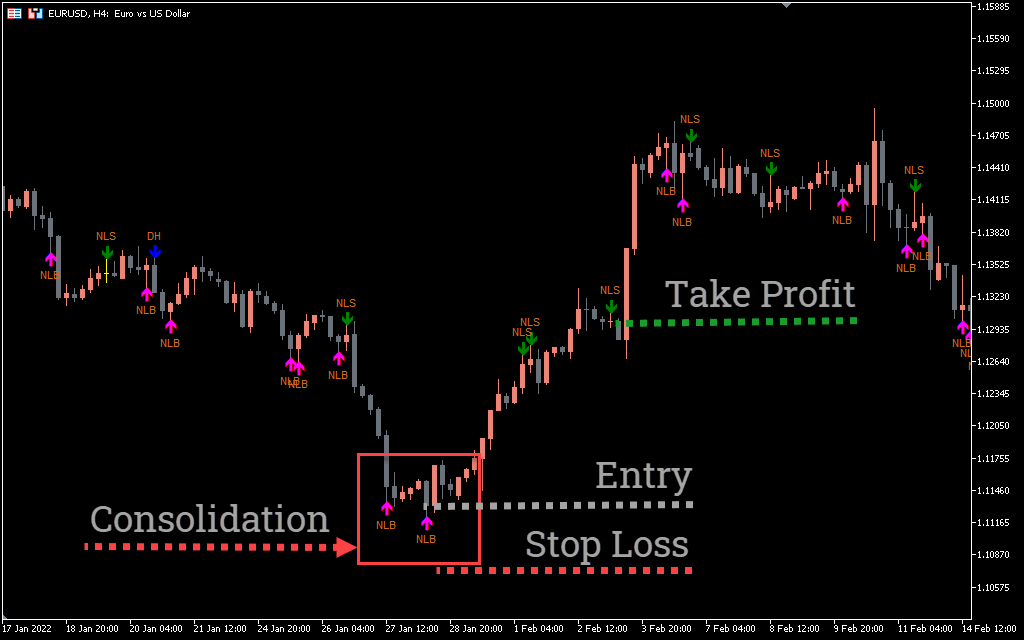
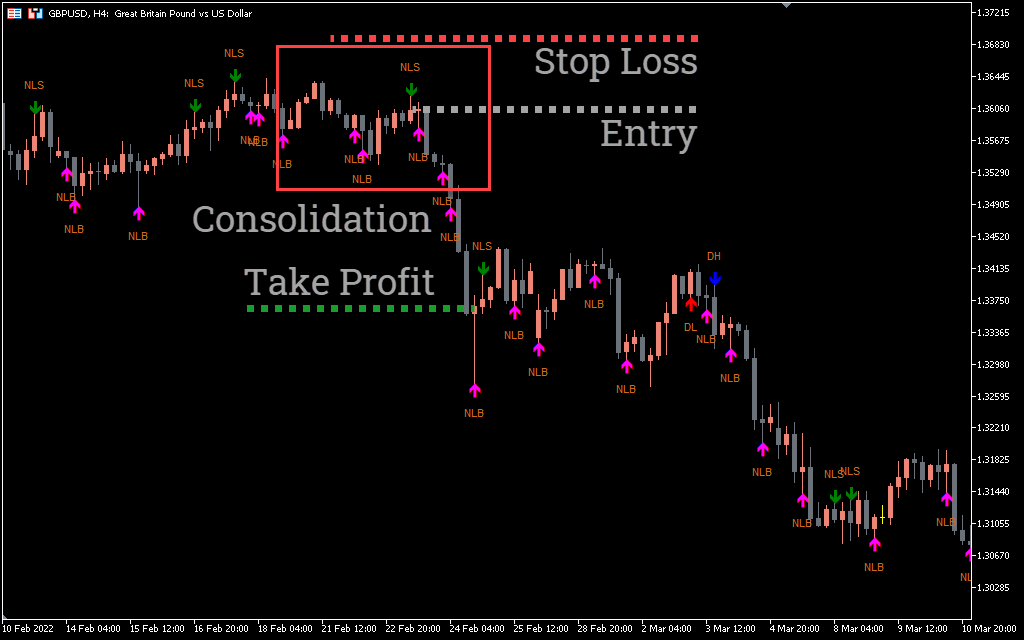
- Look for price consolidation areas.
- Look for a candle with the pink arrow below it with the label NLB.
- Enter a long position with a stop loss below the shadow and exit the position in profit when you see the green arrow at the top of the candle labeled NLS.
Sell setup
- Use a 4-hour timeframe.
- Put the hightwick1 value as 50 and the hightwick2 value as 25.
- Put the lowtwick1 value as 50 and lowtwick2 value as 25.
- Look for price consolidation areas.
- Look for a candle with a green arrow above it with the label NLS.
- Enter a short position with a stop loss above the shadow and exit the position in profit when you see the pink arrow below the candle labeled NLS.
Conclusion for My Price Action indicator
The My Price Action indicator helps identify buying or selling pressure. Like any technical indicator, it reduces your manual pattern-finding efforts, but you cannot blindly rely on the indicator. You may need to use confirmation tools or backtest the tool before moving to a live account.