
Murrey Math Indicator
Murray Math Indicator for MT5 automatically scans and plots support and resistance lines so forex traders can BUY and SELL.
Description
Murrey Math indicator for MT5 automatically calculates and plots support and resistance lines. In addition, the lines are marked and represent the reversal lines of the central reversal. Excess lines, excessive overbought and oversold lines, weak stop and reversal lines. However, the final support and resistance lines, as well as the key entry line, are important on them.
In addition, the indicator displays the top and bottom of the trading range. As a result, forex traders can determine the best entry and exit points to buy and sell by testing these lines with price action.
The indicator is well suited for beginners and experienced forex traders. New traders can immediately identify the current market trend and find stop loss and take profit points. However, advanced forex traders can use the indicator for automated trading strategies and formulate complex trading strategies. The indicator works well on all intraday timeframes as well as daily, weekly and monthly price charts. However, forex traders should use the appropriate settings for each time frame.
Murrey Math Indicator For MT5 Trading Setup
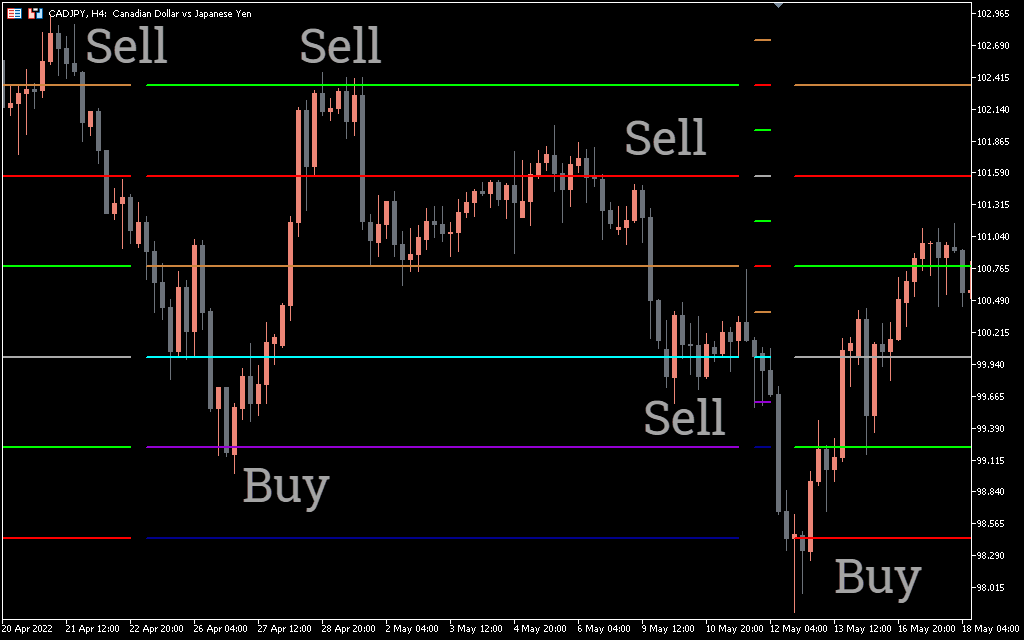
The above CADJPY H4 price chart shows the Murrey math indicator for MT5 in action. The indicator shows an important Pivot Entry Point line in white. At the same time, maximum resistance and marginal support are found in Aqua. The other high and extreme high lines are purple and blue, respectively. The major reversal support and resistance lines are colored red, while the weak stop and reversal lines are colored yellow. Moreover, the top and bottom of the trading range are colored green.
As long as the price remains above the central midpoint, it is bullish, and the opposite is true for bearish price levels. Forex traders should place a BUY position if the price rises above the pivot point line, indicating a bullish price trend. The best stop loss is below the previous support line and the next resistance acts as the best take profit point.
Similarly, if the price remains below the pivot point line, it indicates a bearish market trend. Thus, forex traders should open a sell trade with a stop loss above the resistance line with profit taking at the next support line.
The final support and resistance lines act as the best price reversal points. Traders should anticipate a reversal at these levels and watch for price action to confirm a reversal.
Conclusion
The Murrey Math Indicator for MT5 provides beginner and advanced forex traders with the best support and resistance levels. These levels help traders identify bullish or bearish price trends and provide the best entry and exit points. In addition, forex traders can download the indicator for free and install it easily.