

Linear Regression Slope Indicator
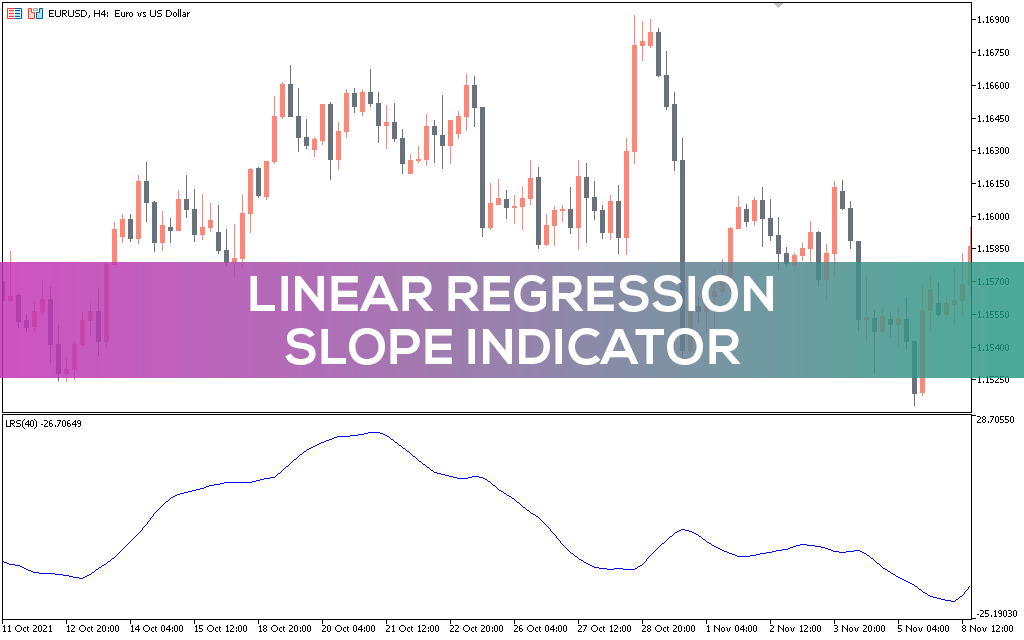
Linear Regression Slope indicator for MT5 shows the direction, strength and momentum of a trend. It is a perfect trend reversal detector.
Description
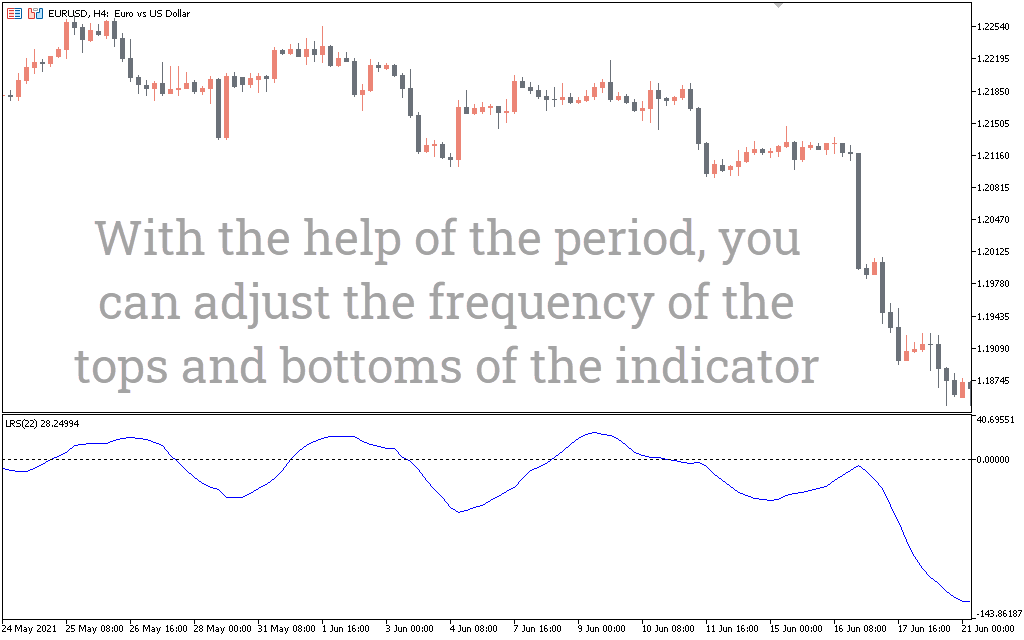
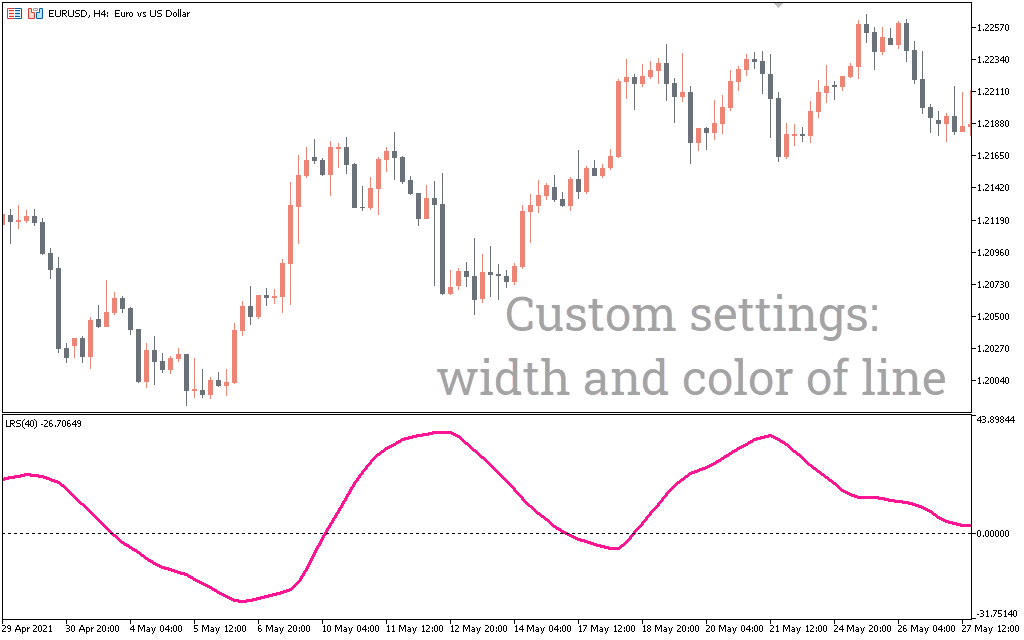
The Linear Regression Slope indicator calculates a linear regression and then plots the slope. The indicator simply draws a blue line that shows the strength and momentum of the trend. This means you benefit from signal generation and allows you to determine when momentum is strong and when it is decreasing.
How to use the slope of linear regression for trading
When the indicator crosses the zero level, the indicator gives a signal to enter a trade. The farther the line is from zero, the more obvious it is a sign of increasing momentum. As momentum decreases, the line tends to zero. In such cases, when pointing to a low market range, it is wise to stay away.
Signals to buy
Buy when the indicator crosses the zero line and the line goes up. Exit when the indicator begins to drop rapidly and falls below zero.
Sell signal
Enter a short position when the indicator bar falls below zero. Exit when it changes direction again and goes up.
Linear Slope Regression Example
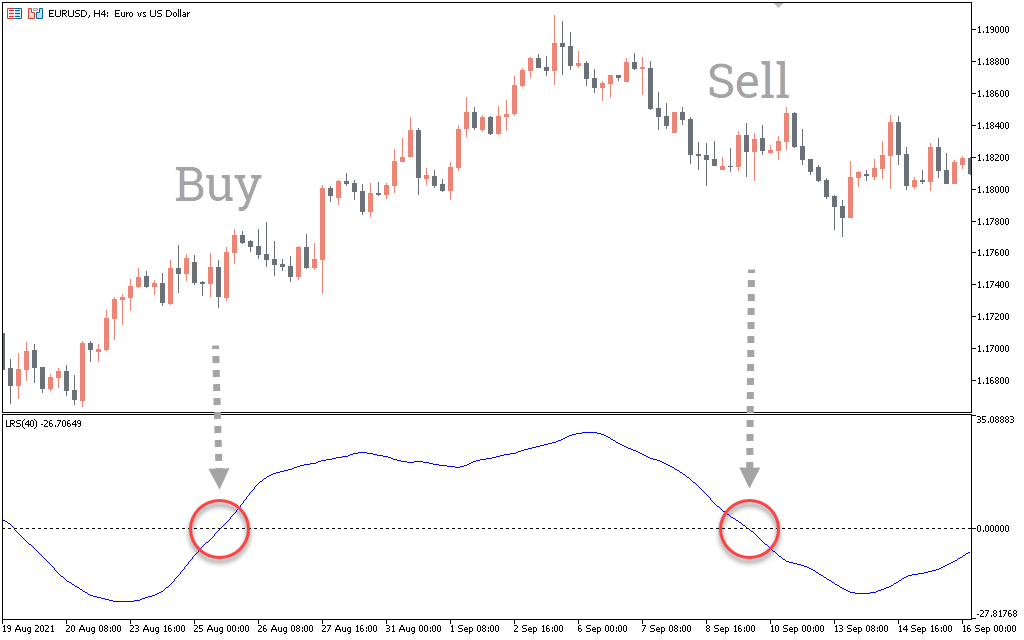
The chart shows the MT5 indicator on EUR/USD H4 price action. When the price fluctuates, the indicator also shows short fluctuations around the zero level.
The indicator shows active growth during an uptrend as momentum increases. Similarly, when the line falls below zero, the market becomes bearish. The more the line descends, the greater the increase in momentum of the downtrend.
Conclusion
The indicator is based on a linear regression line. The indicator plots the slope of the line, which gives signals to buy and sell, and also shows the direction and momentum of the trend.