

Line Break Chart MT4 Indicator
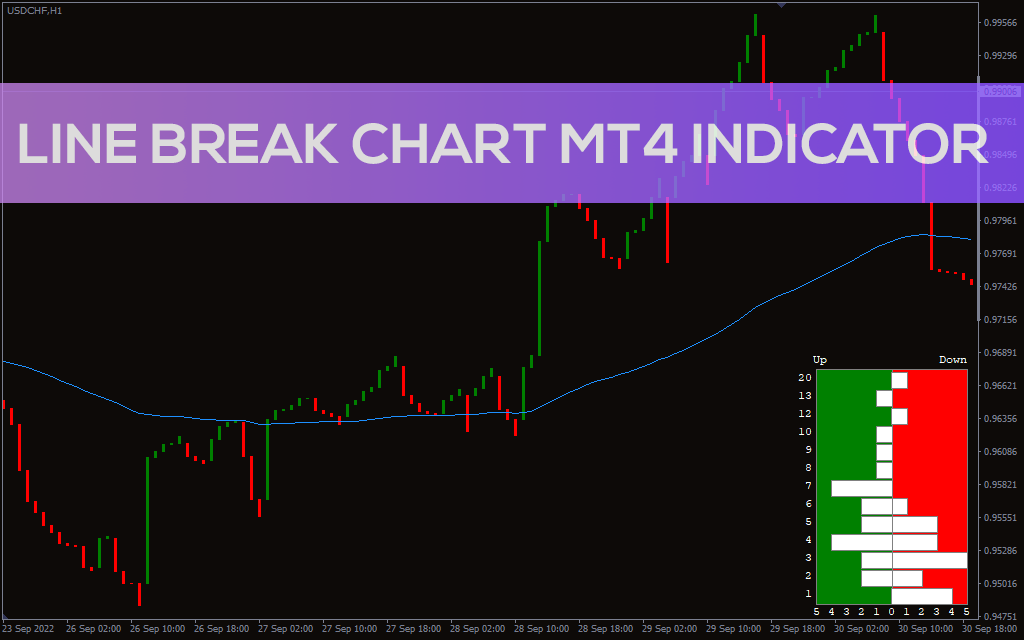
Line Break Chart MT4 is an ideal technical tool for trading the line break strategy. It is a suitable indicator for identifying trend reversal.
Description
When you hear about the line break chart mt4, perhaps the thing that first comes to mind is the three-line break. It is the most popular line break strategy, but you can design your chart to produce a two-line or four-line chart. Like candlesticks, the line breaks have their origin in Japan.
Essentially, the line charts determine prices by the market rather than by arbitrary rules. They tend to ignore time and move according to the closing price. A reversal occurs when the closing line exceeds the highest high or lowest low of the previous lines, typically three lines.
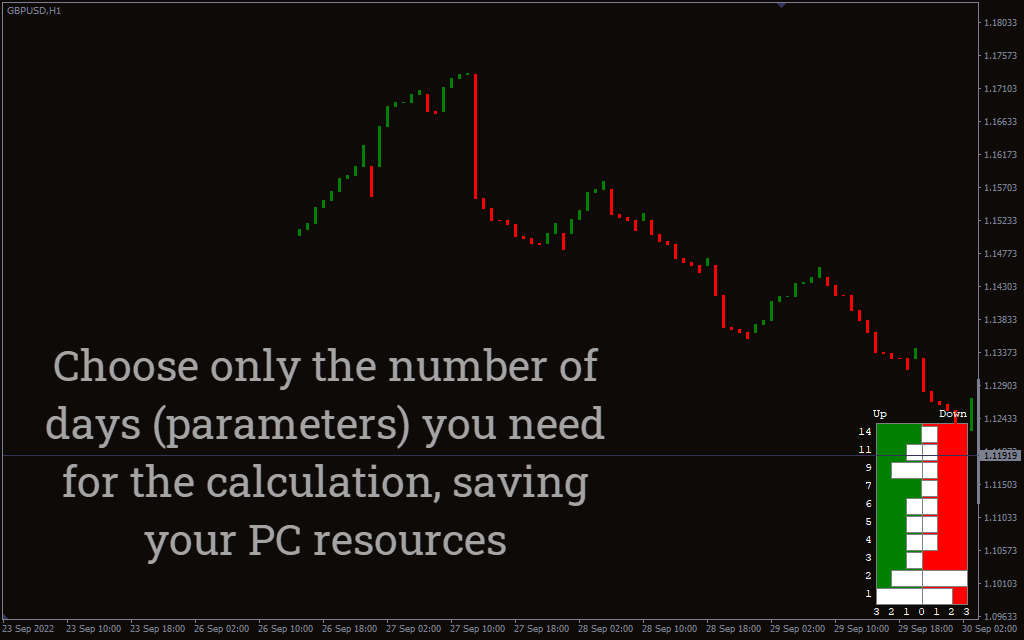
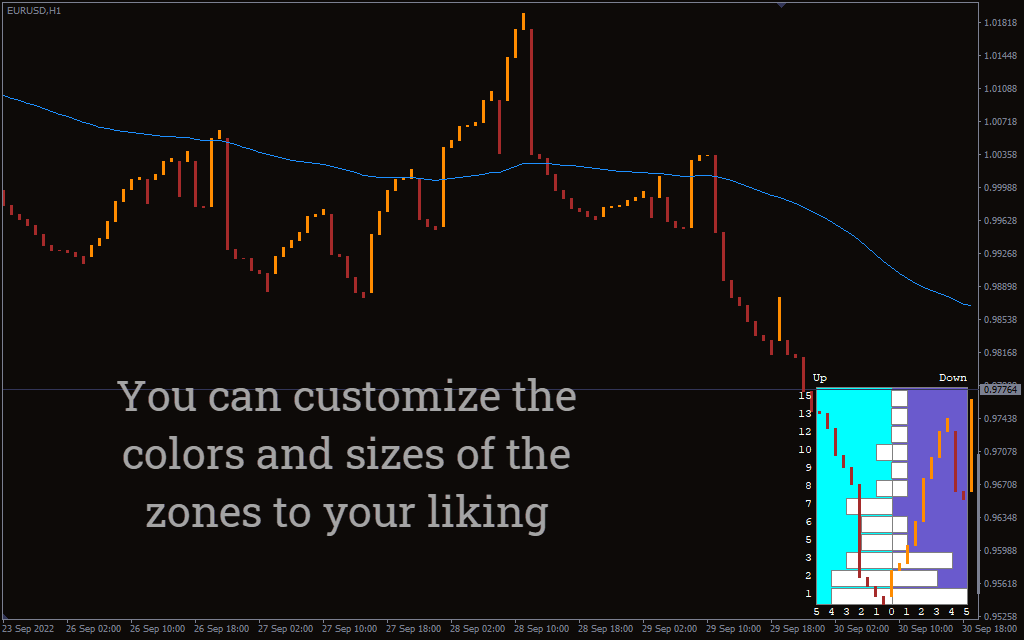
The indicator also posts a sequence frequency histogram showing the distribution of the sequential lows and highs generated over several direction changes. This will help you determine whether the dominant pattern is sequent highs or lows.
You can use the indicator to trade any instrument in any time frame. The indicator works well for short and long-term trading strategies. This means that you can trade the indicator in any time frame.
How To Use Line Break Chart MT4 to Trade
Typically, trading the line break chart involves using three lines. This means that a reversal occurs when a line surpasses the low or high of the previous lines.
Buy Signal
Buy when a green line surpasses the highs of the previous three lines. That is a telltale sign that the price action is reversing upwards.
Sell Signal
Sell when a redline surpasses the lows of the previous three lines. This signifies the price action is reversing, and the downtrend will dominate the market.
Line Break Chart MT4 Trading Example
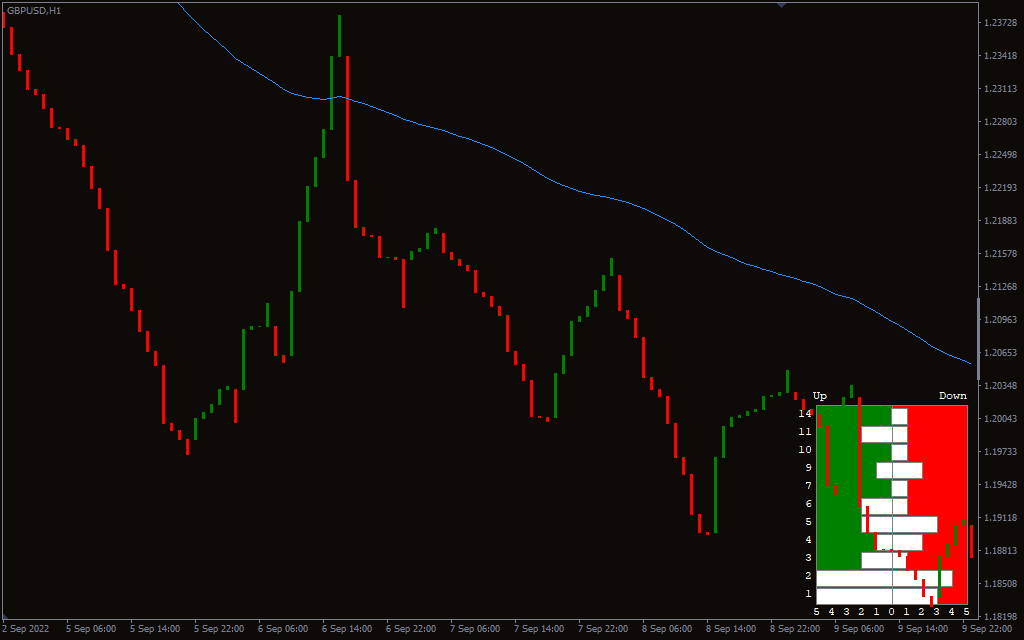
The chart shows the GBP/USD price action. An extensive bearish red line appears after the three bullish green lines. In this case, the three diminutive green lines could signify a bullish trend. However, the red line closes below the close of the three bullish green lines. This is an indication of a downward reversal. You should therefore get ready to open a short position. The price reverses and enters into a strong downtrend.
Conclusion
The Line Break Chart MT4 is a brilliant tool for trading with the break line strategy. You just want to wait for a line to break below or above the low or high of previous lines, typically three lines. You should try it, shouldn’t you?