

KG Support And Resistance Indicator
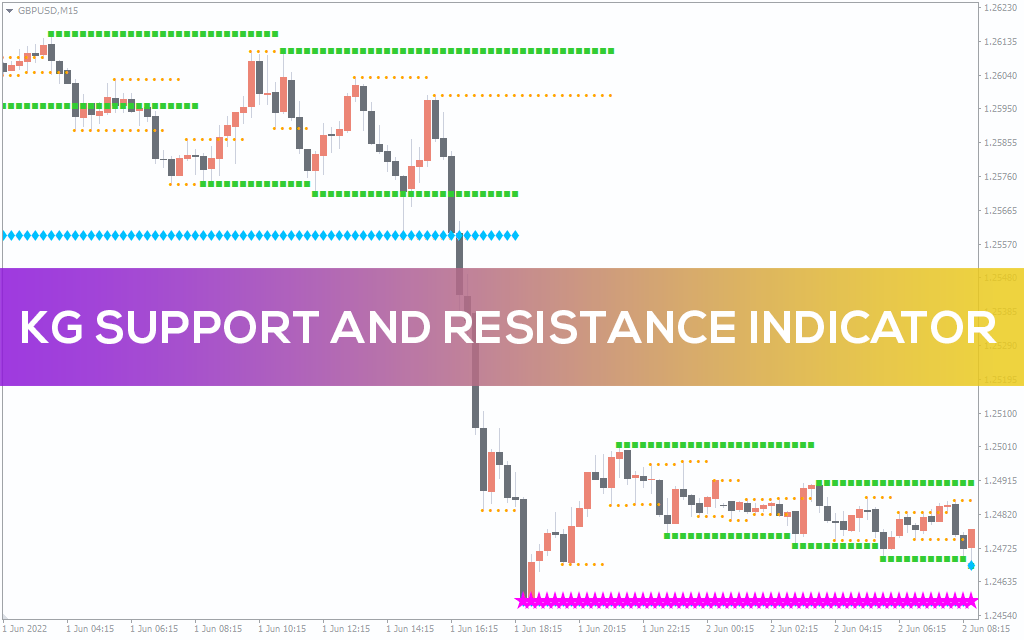
KG Support and Resistance Indicator automatically maps high-probability support and resistance zones across multiple timeframes, helping traders identify reversal levels with precision.
Description
The KG Support and Resistance Indicator for MT4 is a highly visual and effective tool designed to automatically detect and draw key support and resistance zones on the chart. These zones are critical areas where price tends to reverse or stall, making them valuable reference points for trade entries and exits. Unlike manual plotting, which can be subjective and time-consuming, this indicator generates zones based on historical price behavior, offering objective, multi-timeframe insights to all types of traders.
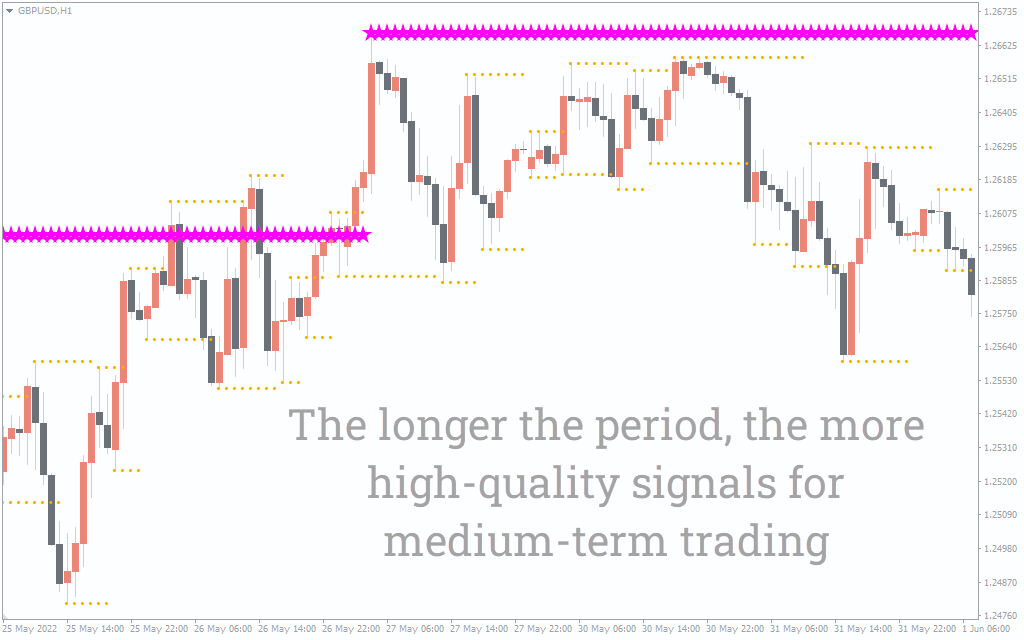
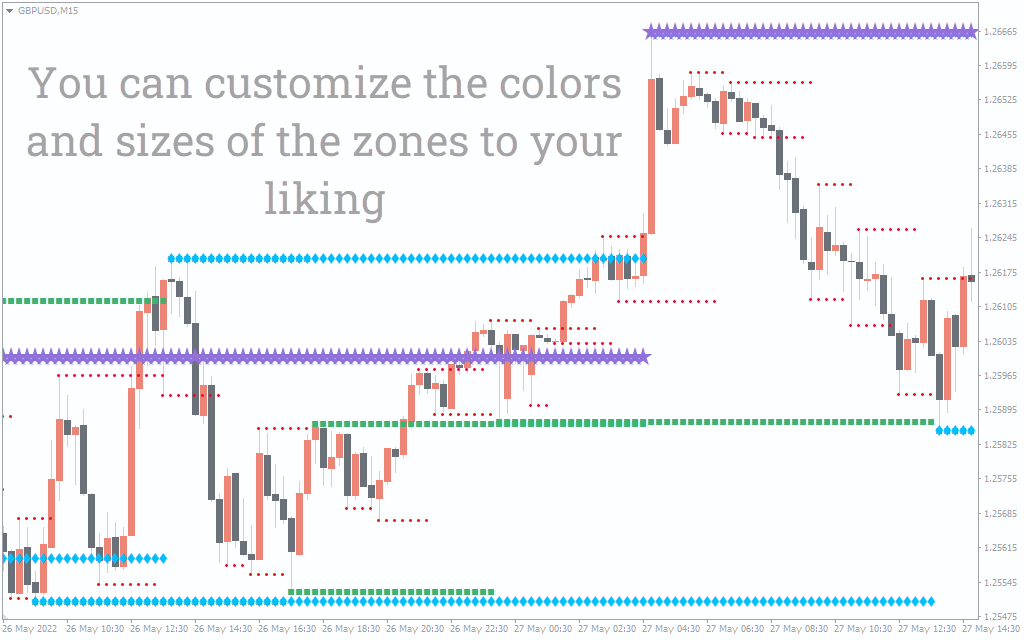
A standout feature of this indicator is its color-coded zones, where each color represents a different timeframe. For example, yellow lines may indicate support and resistance on the 15-minute chart, while green, blue, and magenta represent 1-hour, 4-hour, and daily levels respectively. This visual structure allows traders to quickly assess which levels are more significant based on higher timeframes and where multiple zones may align for confluence.
KG Support and Resistance Indicator Trading Signals
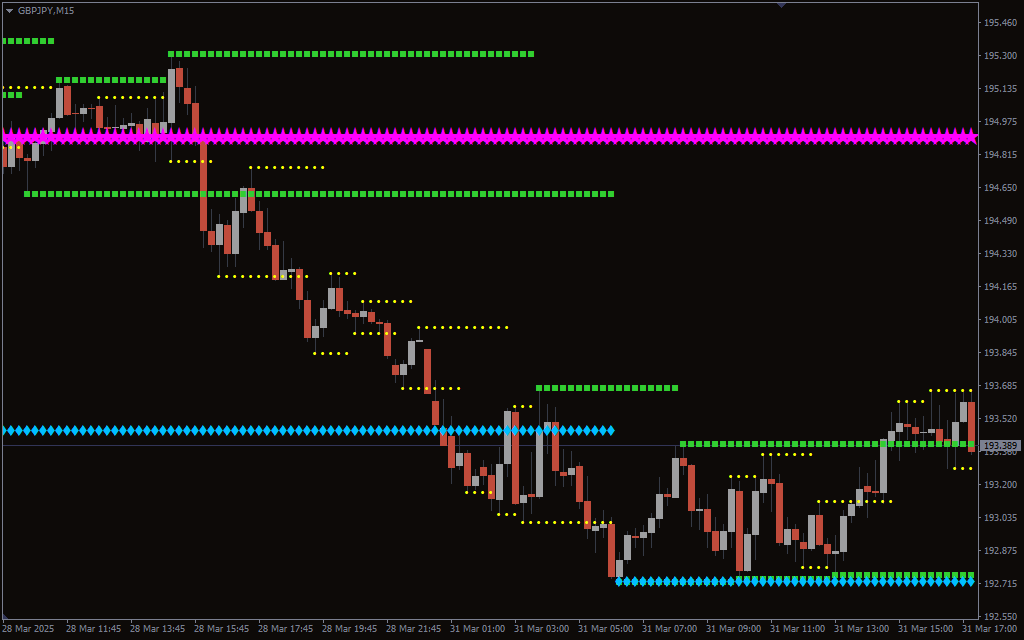
This indicator does not give direct buy or sell signals but instead highlights potential reversal or breakout zones. Traders can use the nearest support or resistance area to make informed decisions—such as entering long when price bounces from support or entering short at resistance. The more times a level has been tested, the more significant it becomes. Combining these zones with price action or other technical indicators enhances accuracy and helps avoid false breakouts.
Because each zone is tied to a specific timeframe, overlapping levels across different colors can signal stronger support or resistance areas. For instance, if both a 1-hour and 4-hour zone align, that level may act as a high-probability reversal point.
Conclusion
The KG Support and Resistance Indicator is an essential addition to any technical trader’s toolkit. By automating the identification of crucial price levels, it simplifies analysis and increases the efficiency of trade planning. Its multi-timeframe approach gives traders a layered perspective on market structure, helping them stay ahead of reversals, breakouts, and consolidations. The color-coded zones tied to different timeframes make it easy to visually prioritize strong levels and act accordingly. Whether you use it standalone or in combination with other tools, this indicator offers practical and actionable insights. Download it today to enhance your market timing and trading accuracy.