

Heiken Ashi Indicator
The Heiken Ashi Indicator is particularly used to ride a trend for a long time and to exit the market when the trends become weak.
Description
The Japanese candlestick, one of the 3 charting systems used in forex, is the most common and preferred chart for technical analysis. The candlestick shows the open, high, low and close of each bar, and also indicates if the candle is bullish or bearish. Despite the fact that this chart is the most preferred, it is prone to numerous false signals due to a lot of noises in the market. The difficulty encountered using Japanese candlestick is corrected using the Heiken Ashi Indicator.
Foundation
The Heiken Ashi Indicator is a type of Japanese candlestick that takes the average of the 2 periods, thus making it smoother than the ordinary candlestick.
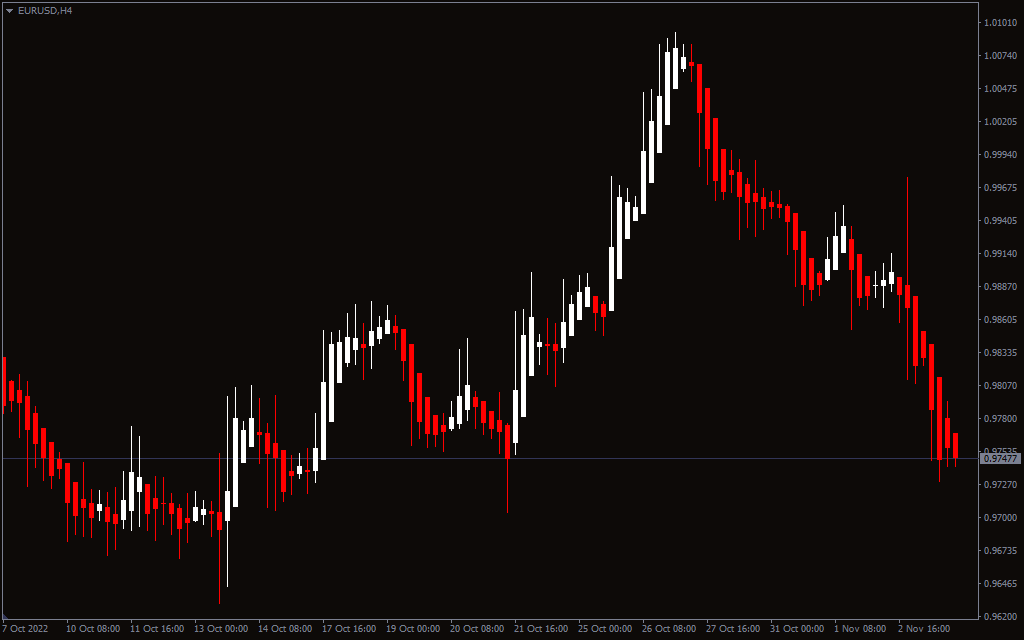
The diagrams below show the EUR/USD H4 of 2 different charts:
- the Heiken Ashi Indicator
- the ordinary Japanese candlestick
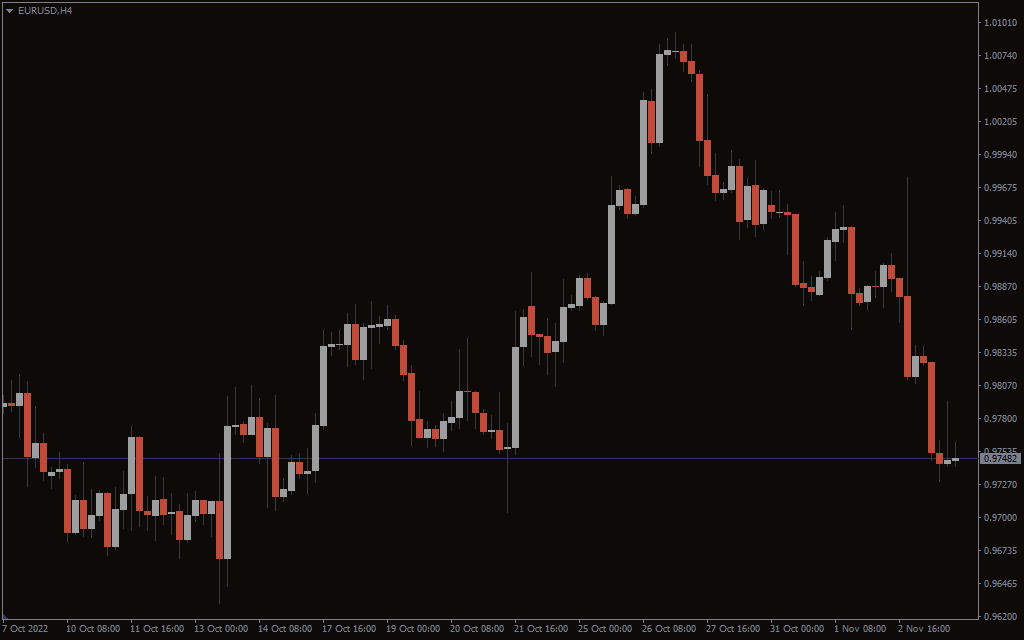
From the 2 diagrams above, the ordinary Japanese candlestick charts frequently change from red to green, which can make them difficult to elucidate.
Conversely, candles on the Heiken Ashi chart display more uniform colored candles, staying red in a downtrend and green in an uptrend.
Since the Indicator helps smooth out charts and filter out market noises, it is easier to spot a trend and trend reversals.
Spotting a trend and a trend reversal with this indicator helps traders to determine whether to hold a position or exit the market.
The Heiken Ashi Indicator is particularly used to ride a trend for a long time and to exit the market when the trends become weak.
How to Use The Heiken Ashi Indicator
The Heiken Ashi Indicator is used by technical traders to identify trends.
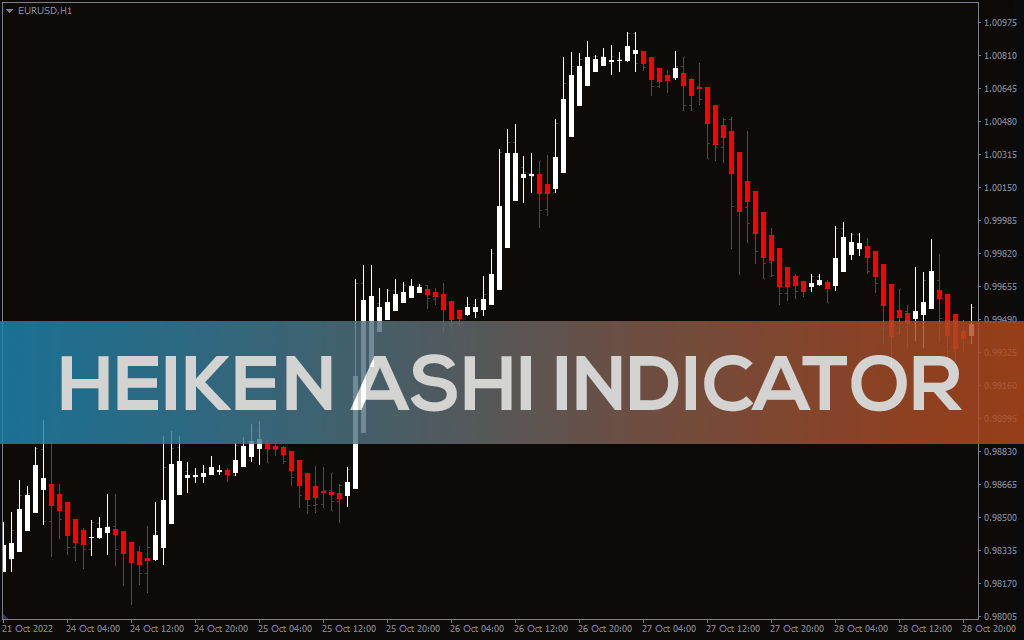
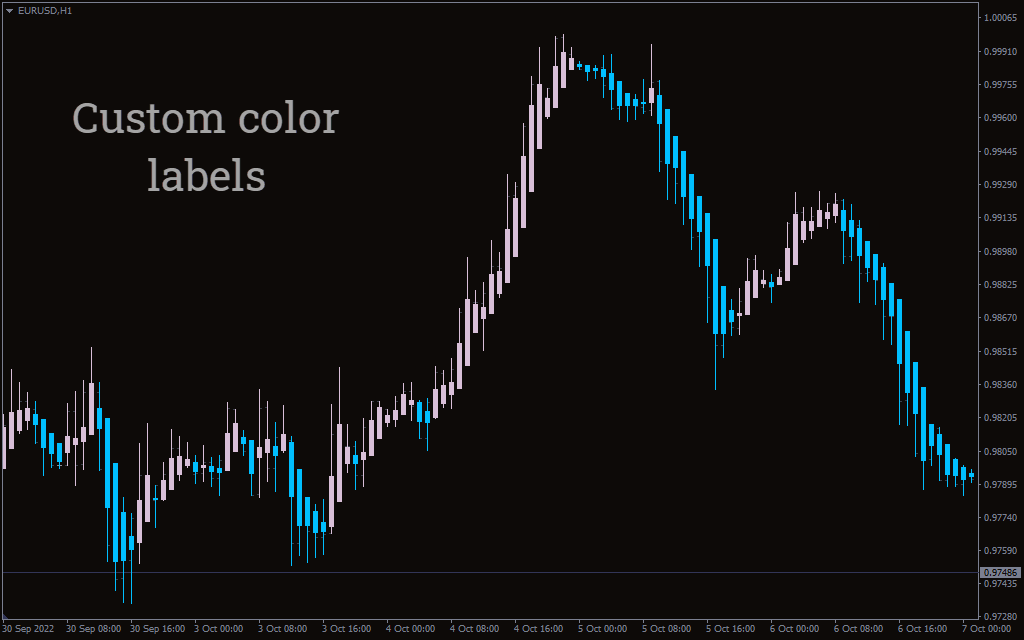
The red candles of a Heiken Ashi Indicator means the trend is a downtrend. On the other hand, green candles means the trend is an uptrend as indicated in the diagram below.
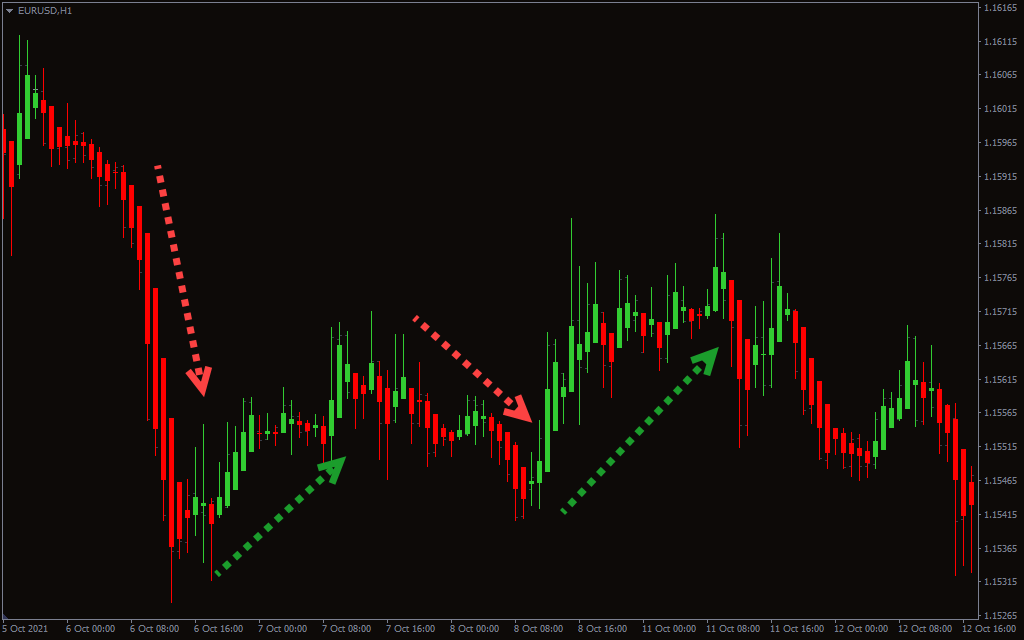
Also, the wick of the Indicator candles can be used to identify the trend strength.
Bull candles with no lower wick in an uptrend signify the uptrend is strong.
Furthermore, bear candles with no upper wick in a downtrend signify the downtrend is strong.
When the Heiken Ashi Indicator candle changes from green to red, it is a signal that a downtrend is forming; long trades should be closed while short trades can be opened.
Consequently, when the Indicator candle changes from red to green, it is a signal that an uptrend is forming; short trades should be closed and long trades are recommended.
The Heiken Ashi Indicator candles can also be used just like the ordinary Japanese candlesticks to stop reversal signals such as doji, spinning top, etc.
Conclusion
Heiken Ashi Indicator is most suitable for spotting and riding a trend for long. Because of this, the indicator is best suited for trend traders.
In addition, this indicator reduces false trading signals in a sideways or choppy market and thus helps traders to avoid entering the market during this condition.
These indicator candles take longer time to respond, and thus, it is not suitable for scalpers and intraday traders.
The indicator is best used for swing trading and position trading to ride the trend for a long period.