Full Stochastic Indicator
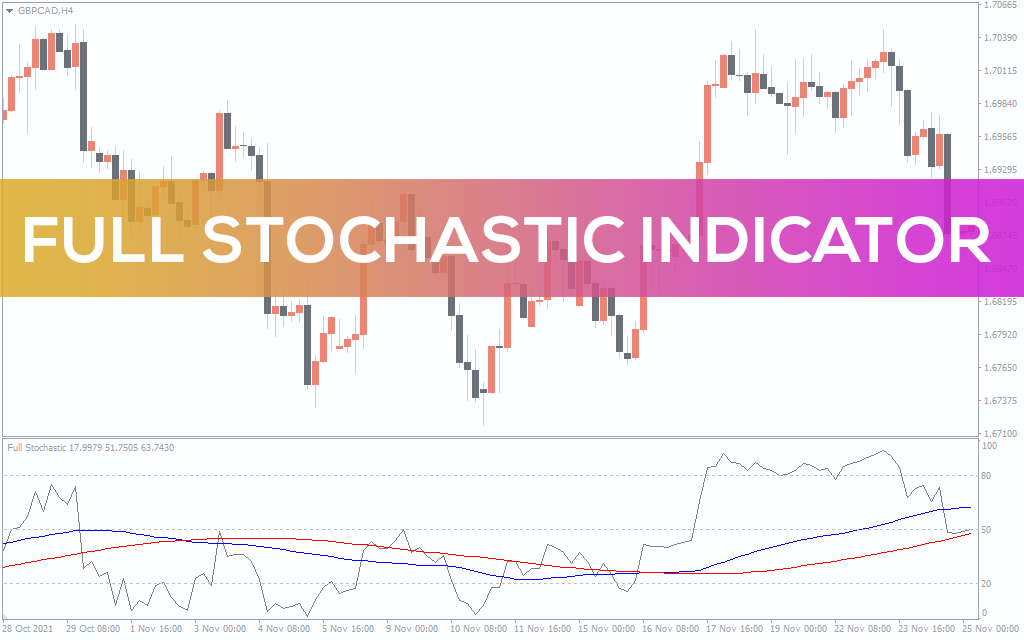
Best Buy-Sell signal indicator for MT4. Full Stochastic spots price swing positions, breakout points, and bullish/bearish momentum signals. Suits MTF charts.
Description
The Full Stochastic is a technical momentum indicator developed for MT4 platforms. It generates crossovers and overbought/oversold signals for identifying potential trend-following buy-sell opportunities. Unlike general Stochastic oscillators, this indicator is more steady in highly volatile markets. It delivers accurate momentum signals during choppy and sidelined market conditions.
Forex and stock traders apply Stochastics to determine the possible trend reversal points. It helps them to verify the potential price swing positions in trend-following markets. Also, you can examine the strength of a price breakout using its super momentum signals. The Full Stochastic indicator determines market highs and lows using a slow K-Line (signal line). At the same time, it identifies bullish/bearish market momentums applying crossovers between %K and %D.
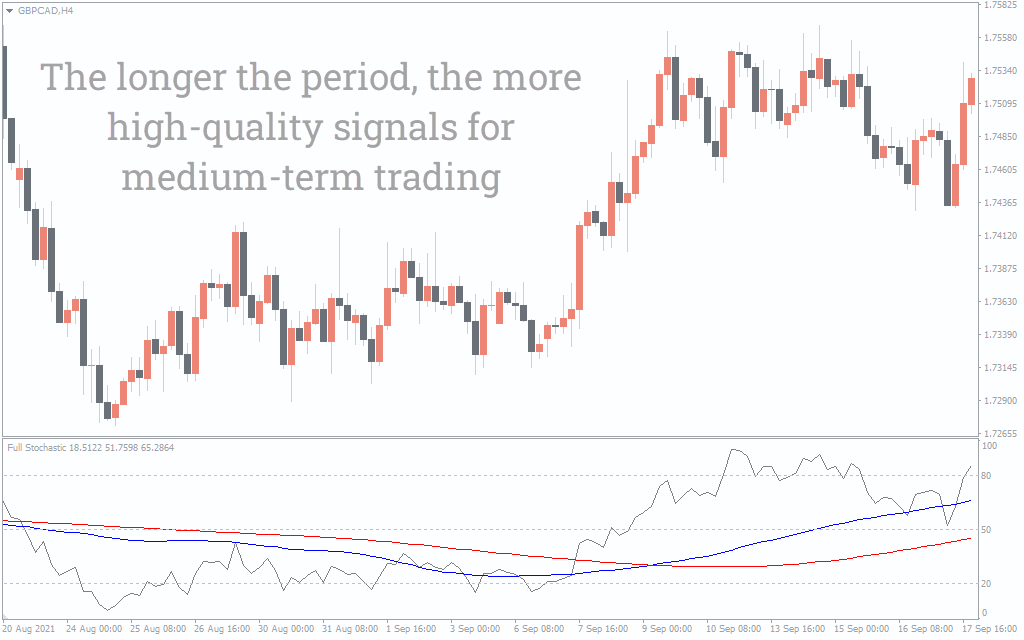
So, the idea is to combine momentum and overbought/oversold signals with adding more confirmations to your buy-sell entry. Furthermore, it suits MTF charts and works equally well in all timeframes. Read through this tutorial guide to learn more about how to trade using the Full Stochastic indicator in MT4.
How to use the Full Stochastic MT4 indicator for identifying potential buy-sell signals
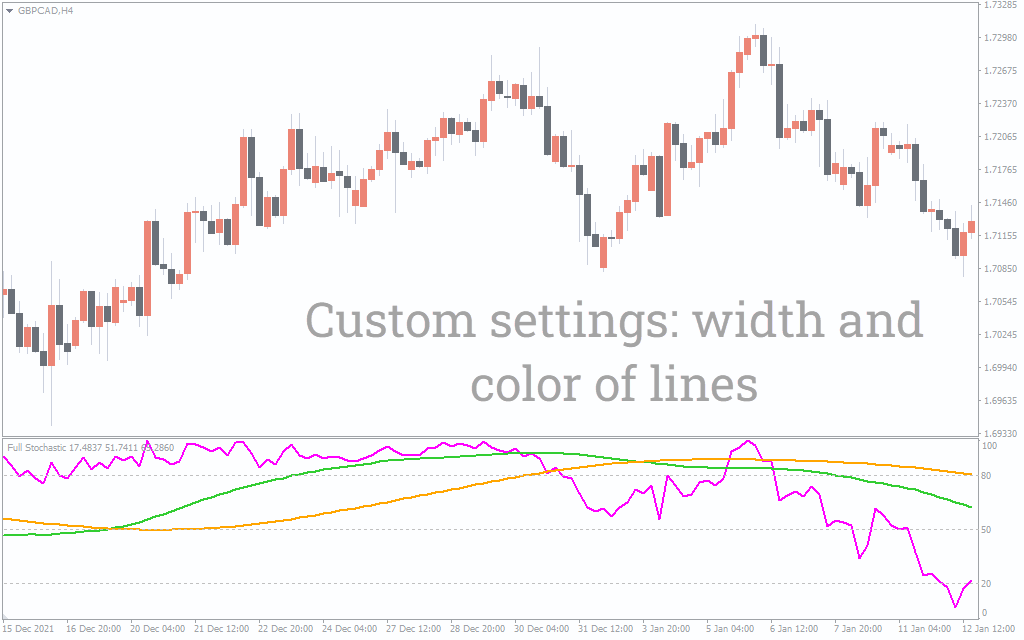
The Full Stochastic uses the slow K Line in gray color to signal the OB/OS market. Its value hits 80 during an overbought market and drops near 20 to signal an oversold condition. Besides, the K(blue) and D(red) lines give you an overview of the current trend condition by plotting crossover signals. The K-Line exceeding D indicates bullish momentum. Conversely, the K-Line declines below the D-Line when the momentum turns bearish.
Before placing buy orders, look for a bullish crossover between K and D. Then wait until the slow K-Line hits below 20 (oversold zone). Next, look for a price action signal confirming a bullish breakout at resistance or rejection at support. Consider a buy-exit right after the slow K-Line hits the overbought level (80). Alternatively, hold the long position until the K and D lines plot a bearish crossover for intraday/long-term trading.
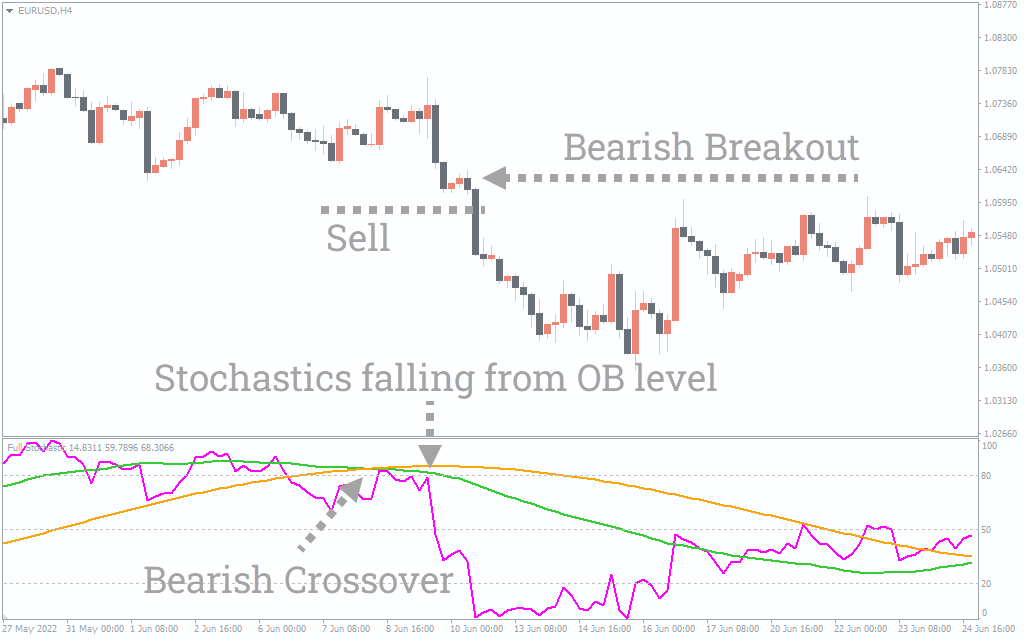
We’ll look for sell opportunities when the indicator simultaneously confirms an overbought price and a bearish market momentum.
The above EURUSD chart shows a selling opportunity following a bearish price breakout at the support(1.0625). During the breakout, the K and D lines plotted a bearish crossover. At the same time, the slow K-Line was declining from the overbought zone, confirming the sell entry.
Conclusion
The Full Stochastics indicator offers accurate and steady momentum signals in MT4 trading platforms. Both forex and stock traders can use it to assess buy-sell opportunities in live markets. Moreover, it works steadily on MTF charts and in all market conditions. We recommend this indicator to beginners struggling to identify bullish and bearish trends while trading live in the market.