

Fibo Pivot v2 Indicator
The Fibo Pivot v2 indicator for MT5 automatically plots support and resistance levels using Fibonacci and Pivots.
Description
The Fibo Pivot v2 indicator for MT5 automatically calculates reversal levels. The indicator builds support and resistance levels based on 0.38, 0.62 and 0.99 Fibonacci levels. This is the main difference between this indicator and other versions of the reference line indicators. Because the indicator combines the popular and powerful Fibonacci calculation with pivot points and plots support and resistance lines.
Forex traders can rely on this indicator to identify bullish and bearish market conditions and buy and sell accordingly. The indicator is well suited for beginners and experienced forex traders. Beginning traders can easily identify three support and resistance lines and use them to calculate stop loss and target profit. Advanced forex traders can use support and resistance levels, as well as trade on a combination of other technical indicators.
The indicator automatically calculates support lines as well as support and resistance lines based on the daily price chart. However, support and resistance remain the same and are visible on lower time frame charts. In fact, pivot levels are best for the day as they will be recalculated at the start of the day. Thus, support and resistance levels work best for all intraday price charts.
Fibo Pivot v2 Indicator For MT5 Trade Setup
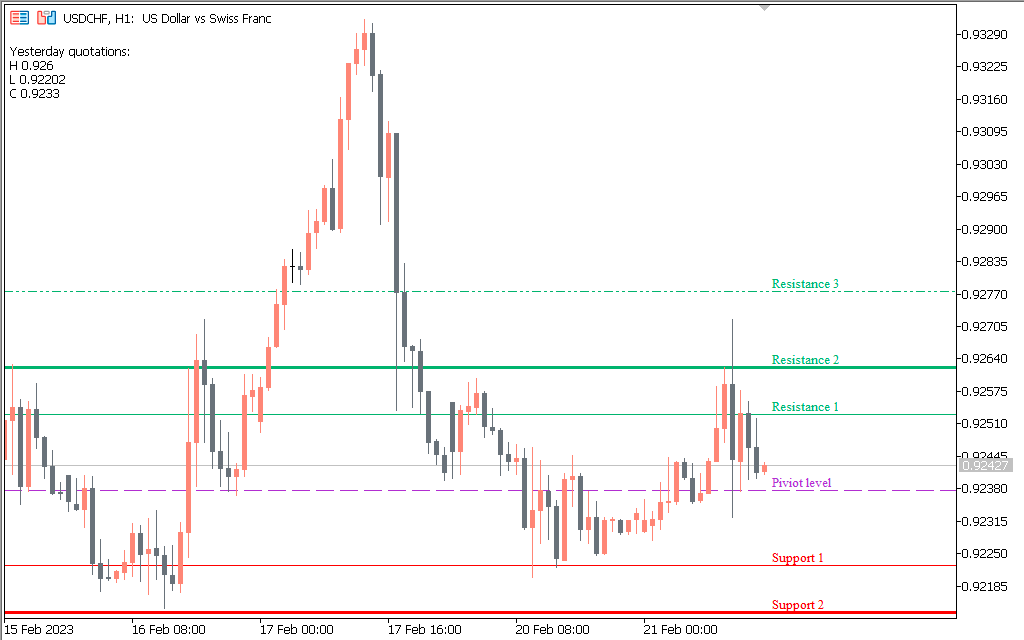
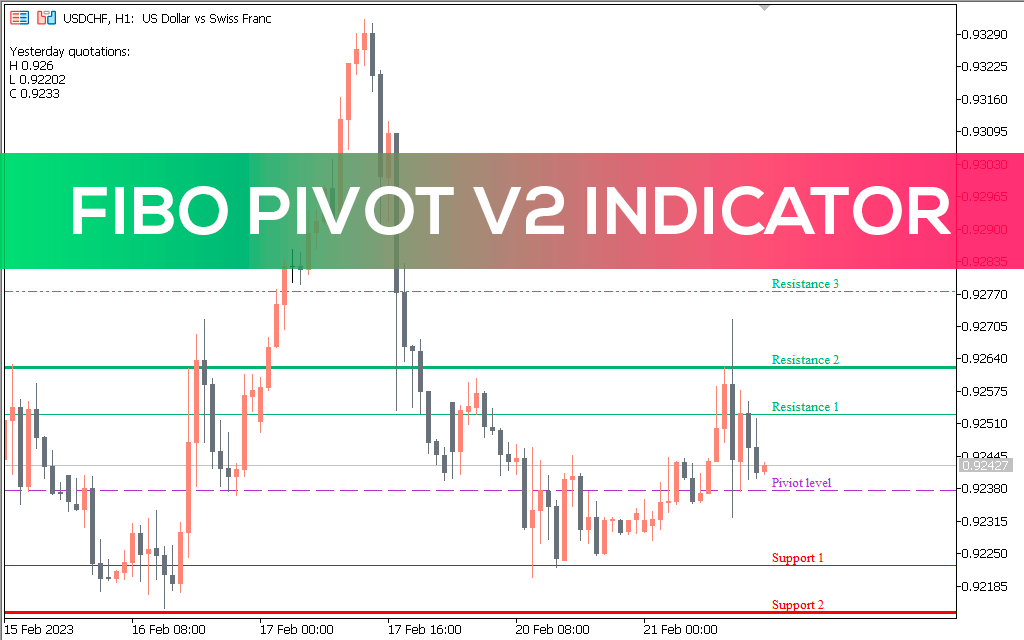
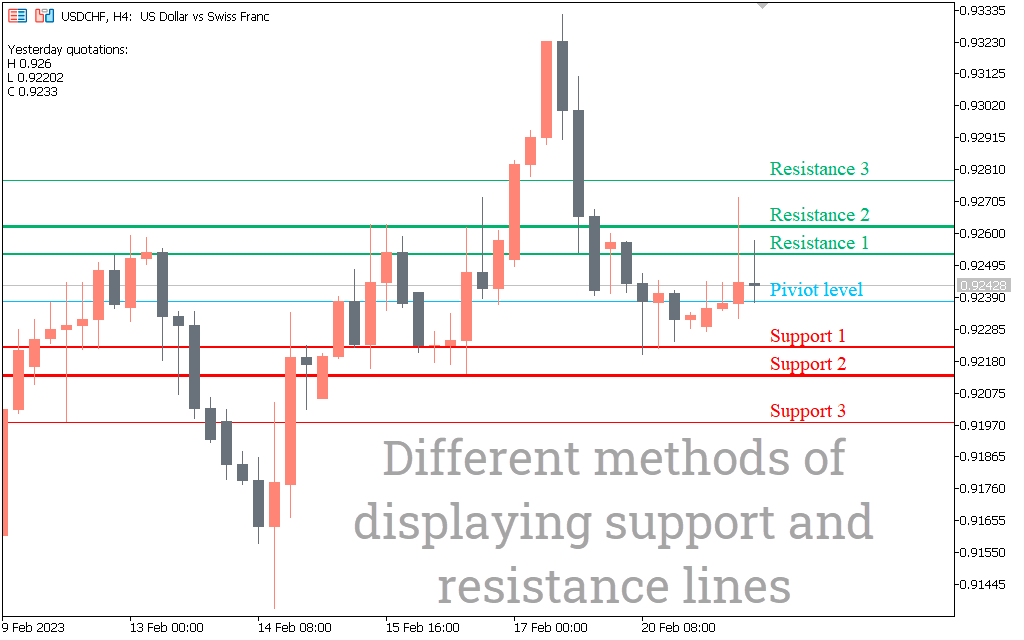
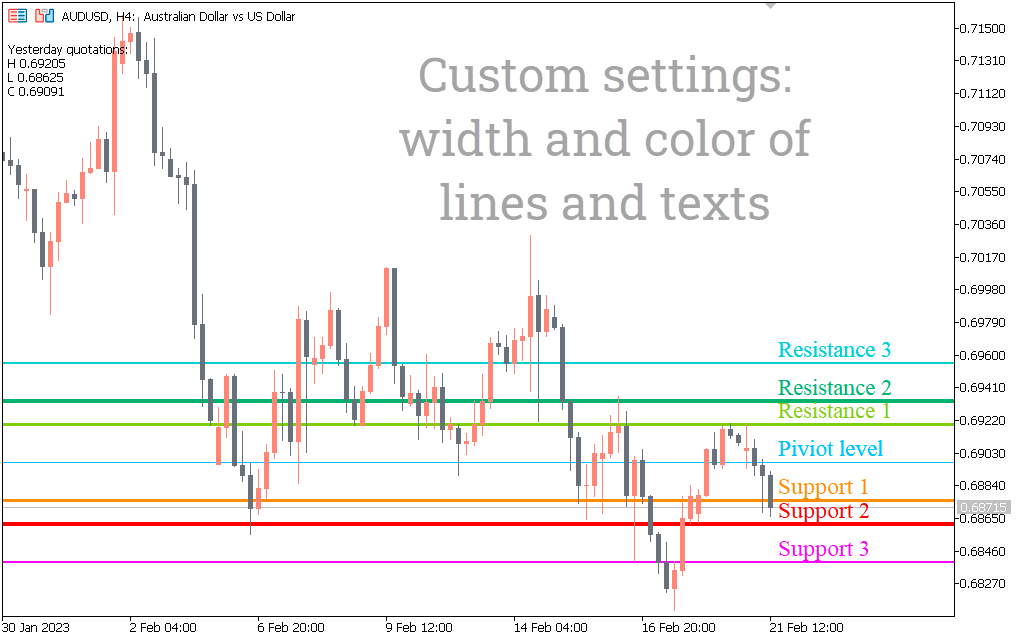
The above USDCHF H1 candlestick charts show the Fibo Pivot v2 indicator for MT5 in action. The indicator automatically calculates and plots the baseline like Majenta. In addition, the indicator draws three resistance lines, marked on the chart as R1, R2 and R3 in green. Similarly, the indicator displays three support lines as S1, S2 and S3 in red.
If the price is above the reversal level, this indicates a bullish market condition. However, traders should open a buy trade if the price breaks the FR1 level or the first resistance line. A stop loss below the reversal level to lock in this trade and a profit target at the next resistance level are effective.
Similarly, if the price moves below the reversal level, then we are effectively in a bear market. But forex traders should wait until the price falls below FS1 for additional confirmation and enter the market with a sell position. Since pivot levels act as good support and resistance levels, it makes sense to place stop loss and take profit levels around them.
Conclusion
The Fibo Pivot v2 indicator for MT5 is a different method for identifying support and resistance levels from a pivot point. While the combination of Fibonacci and reversals may seem exciting, Forex traders must apply price action to confirm price reversals at support and resistance levels. Interestingly, the indicator can be downloaded and installed for free.