Extreme TMA Line Indicator
Extreme TMA Line Indicator for MT5 draw bands to tell the direction of an overall trend. It works best on any timeframe and you can customize its period to suit your strategy.
Description
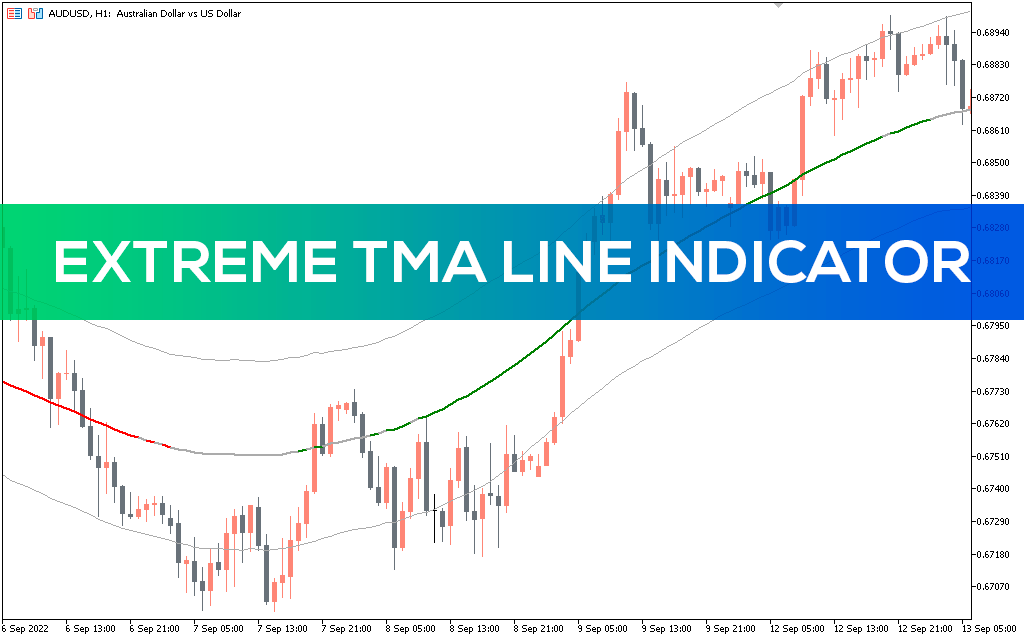
The Extreme TMA Line indicator is a simple MT5 indicator that displays two bands on a chart. TMA is an abbreviation for triangular moving averages. The indicator looks identical to Bollinger Bands, which have one central line and two bands. The upper and lower bands act as support and resistance levels. These levels help identify key entry and exit points.
TMA draws moving averages on the chart using volume and price. The center line of the TMA indicator acts as a trend detector. The line consists of three colors; red, green and yellow.
In a downtrend, the TMA indicator shows red. In an uptrend, the indicator turns green.
Yellow color indicates market neutrality. This means that neither the bulls nor the bears are winning.
The main concept behind the Extreme TMA Line indicator is to smooth out the price data so that the indicator can display the upper/lower bands and the center line.
How to trade the Extreme TMA Line Indicator?
The Extreme TMA Line indicator is great for determining the general trend direction. The center line acts as an entry and exit signal.
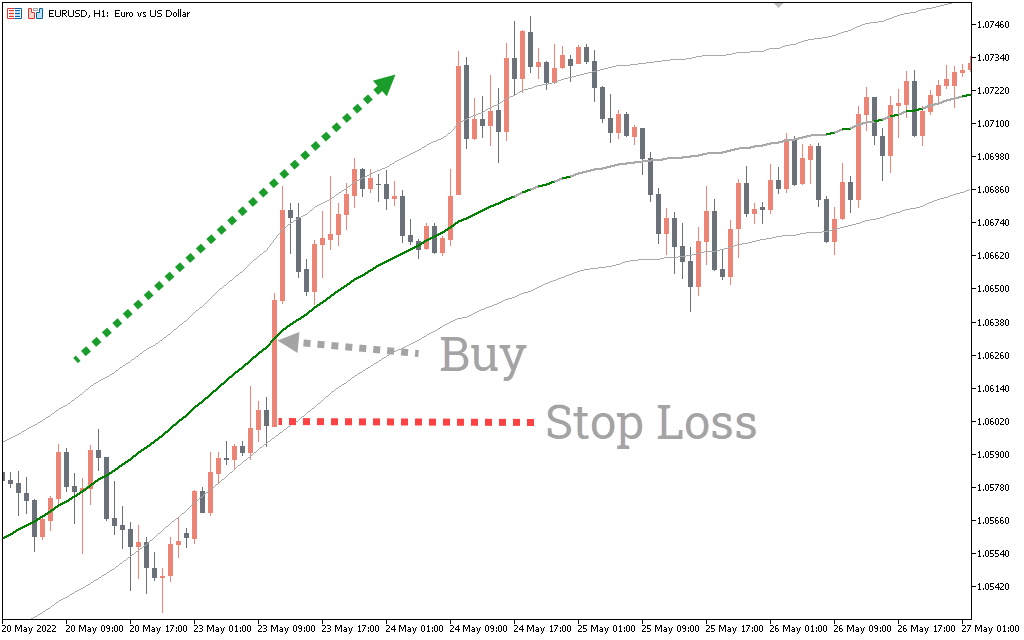
When the indicator builds a green center line, this is a signal to open long positions. On the other hand, when the indicator draws a red center line, this indicates that the bears are taking over and you should go short.
The yellow line is when you should refrain from entering positions. The yellow line represents neutrality and it is best not to enter the market.
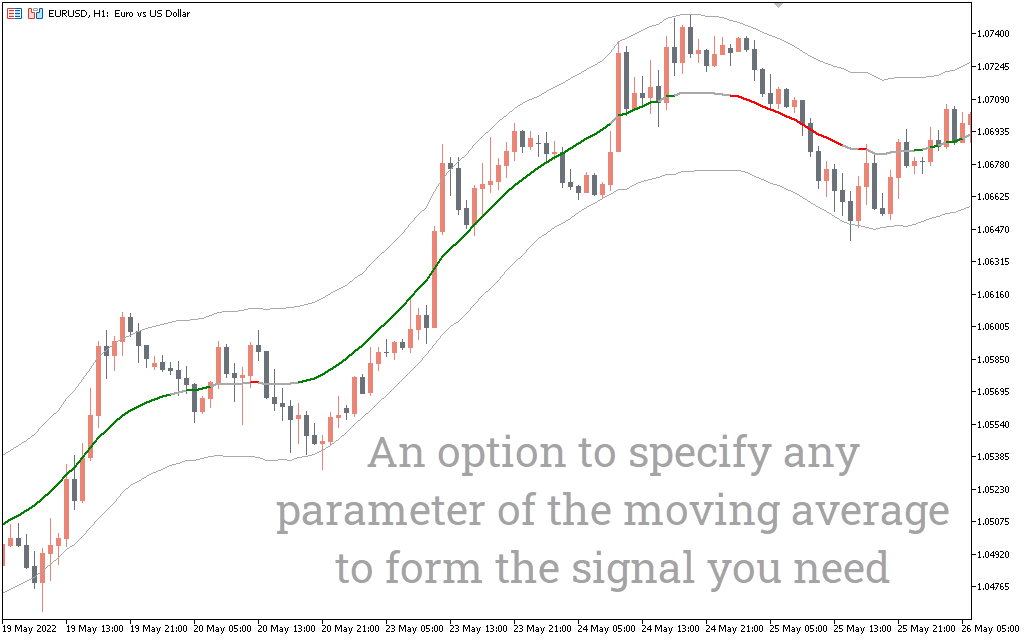
The default TMA period can be customized according to the strategy. For example, when applying short-term strategies, you can set the indicator to a lower period, such as 10.
Let’s find out the strategy of buying and selling by the indicator:
Extreme TMA Line Indicator buy strategy
- The center line of the indicator should be green.
- Wait for the green line to fully unfold before entering.
- Enter a trade on the green line.
- Place a stop loss near the recent low of the buy point.
- Close the trade when the center line changes color.
Extreme TMA Line Indicator sell strategy
- The center line of the indicator should be red.
- Wait for the red line to fully show before entering.
- Enter a trade on the red line.
- Place a stop loss near the recent sell high.
- Close the trade when the center line changes color.

Conclusion
The Extreme TMA Line indicator works best on any timeframe and you can customize its period to suit your strategy. To further confirm the signal, you can combine the indicator with other indicators such as RSI or MACD.