

Double Top Indicator
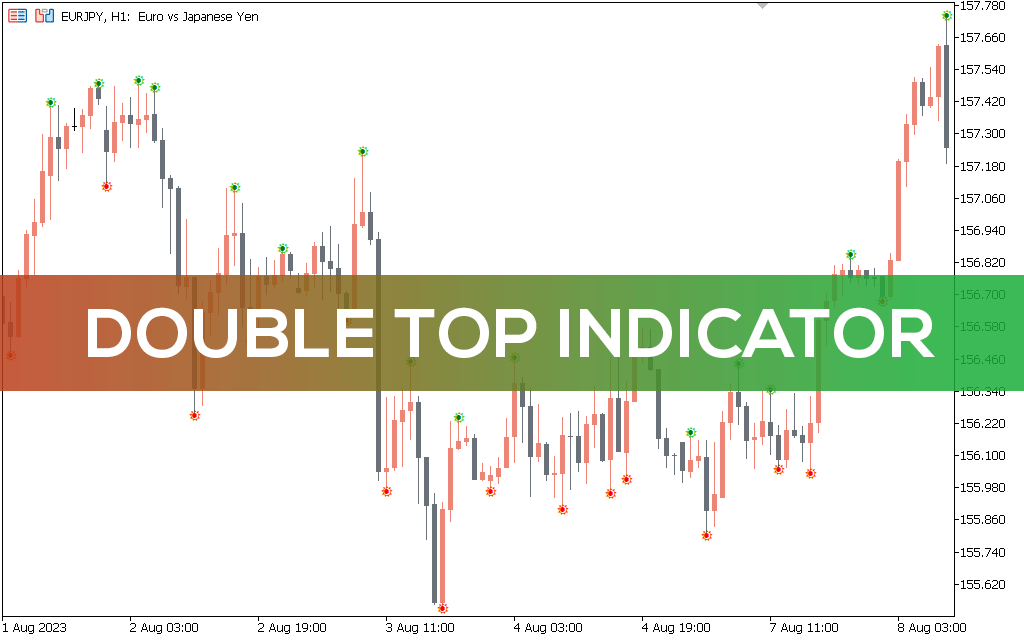
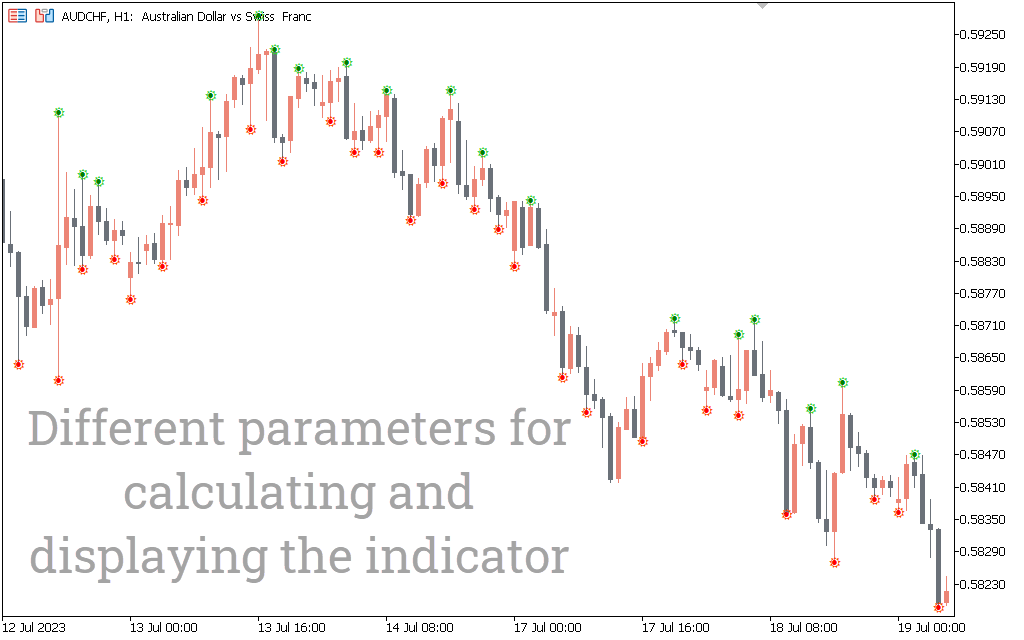
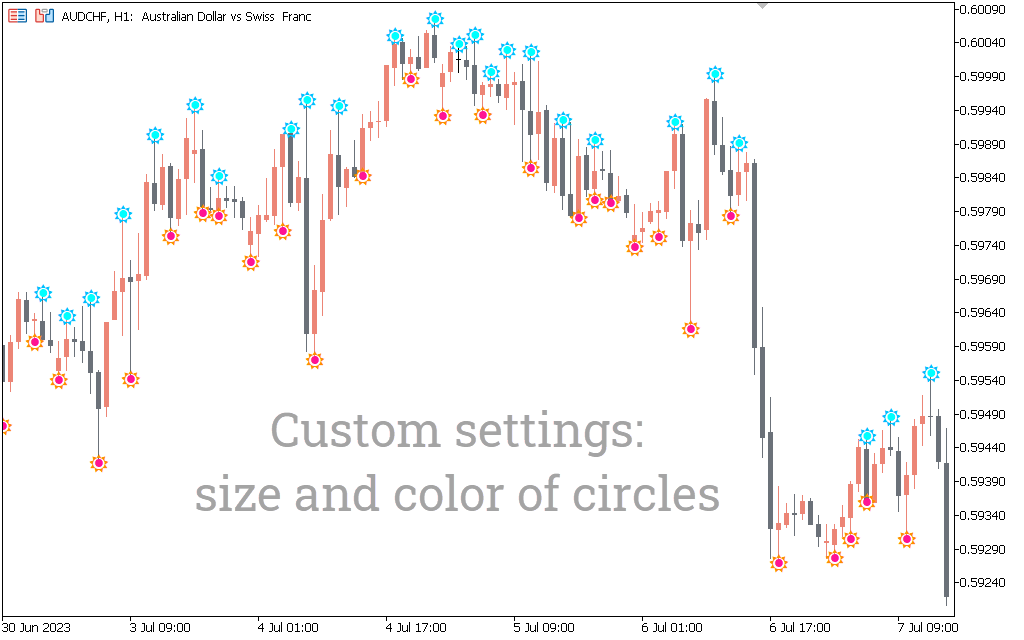
The Double Top indicator draws red and green circles to show a trend reversal.
Description
The double top indicator identifies key market reversals by drawing red and green circles. It displays green circles above the price bars during an uptrend. These green circles indicate the formation of higher highs and higher lows.
In a downtrend, the indicator draws a red diamond, signaling lower lows and lower highs.
The traditional double top pattern is formed when the price reaches a resistance level, retreats, and then makes a second attempt to break this level, but fails. This dip is often seen as a bearish signal.
The indicator makes it easy to spot market reversals with red and green circles. Although the indicator can be applied to any timeframe, it is better to use it on longer timeframes.
How to use the Double Top Indicator for MT5?
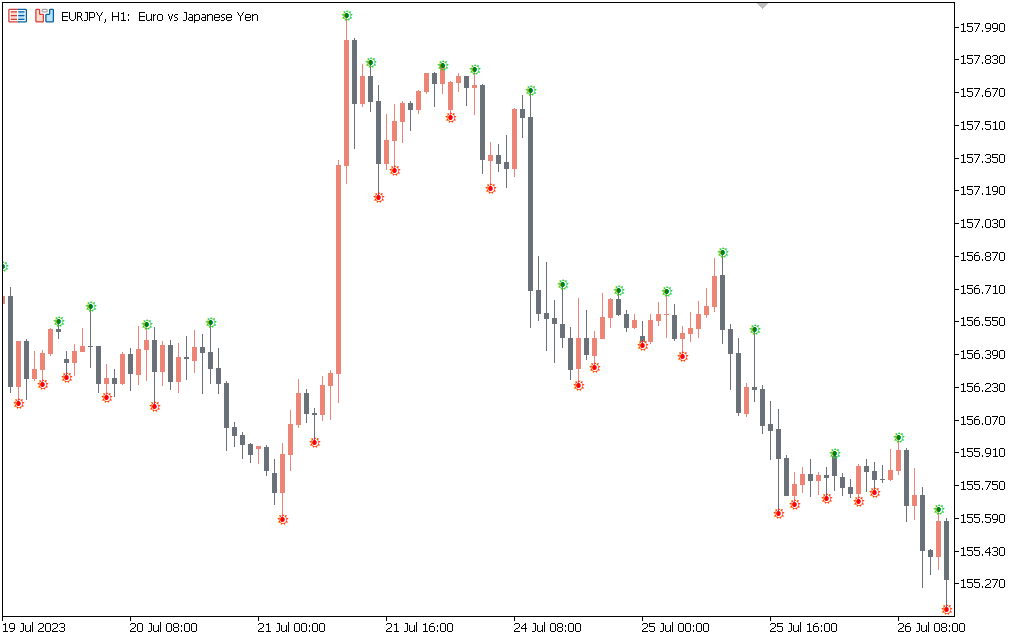
The EUR/USD H4 chart above shows the indicator. The indicator does not show buy and sell signals. Instead, he mentions reversals.
When the indicator draws a green diamond, it suggests a potential bearish to bullish reversal. Conversely, when the indicator draws a red diamond, it suggests a potential bullish-to-bearish reversal.
To look for BUY and SELL signals, you can use the indicator along with other technical tools such as RSI, trend lines or support and resistance.
Conclusion
The Double Top Indicator for MT5 draws red and green circles to illustrate market reversals. By looking at these circles, you can get an idea of the general trend of the market.