

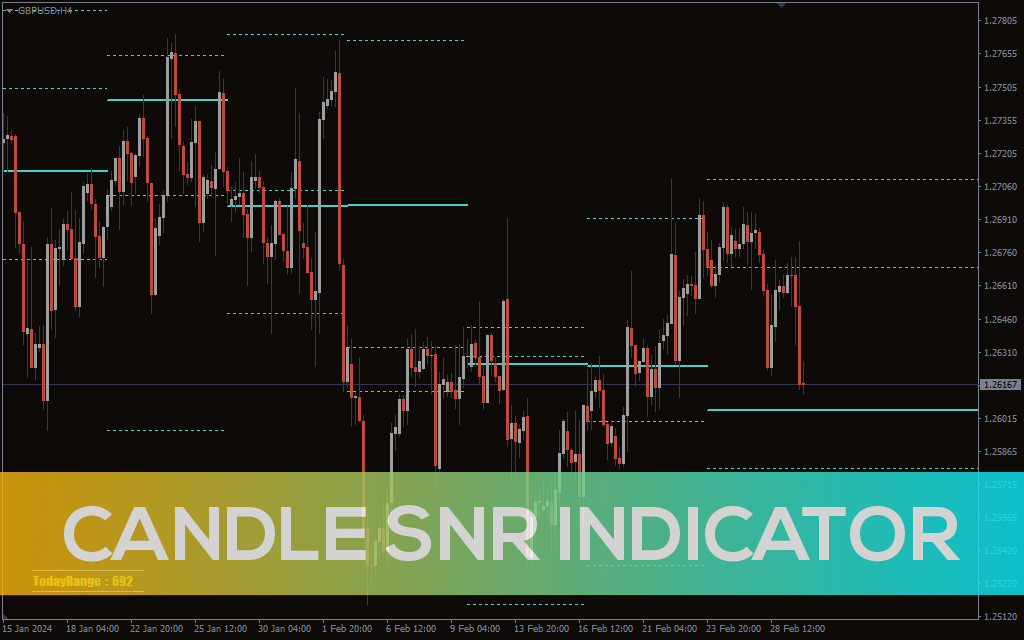

Candle SnR Indicator
The Candle SnR indicator for MT4 detects support and resistance zones across multiple timeframes. Best support and resistance indicator for MT4.
Description
Support and resistance zones are critical levels in the financial trading industry where several trading decisions are made. Traders buy/sell or exit their positions when the price is at a support or resistance zone.
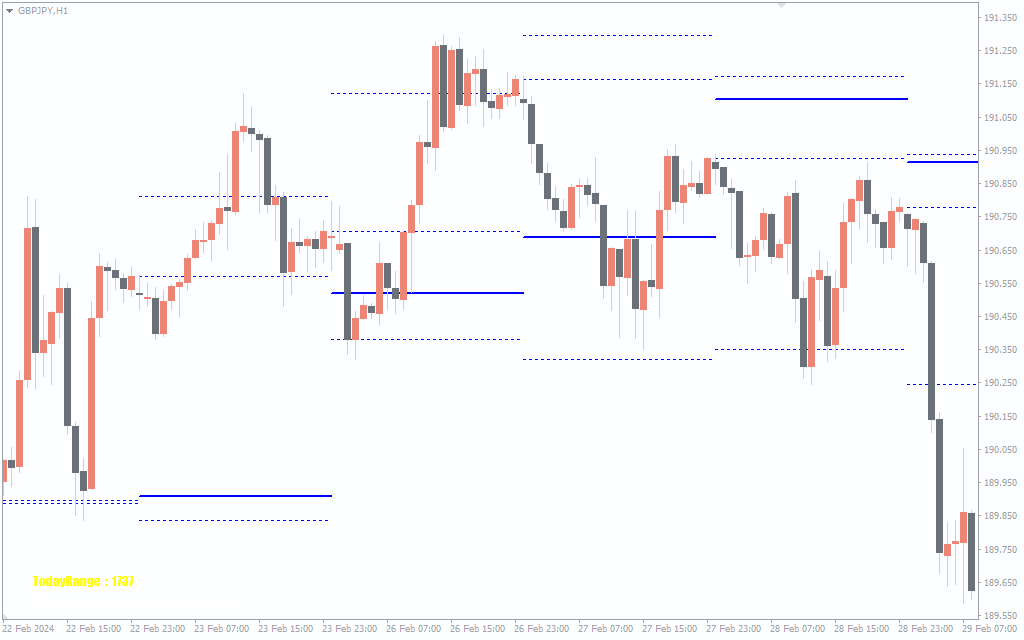
So, the Candle SnR indicator is a MetaTrader 4 that automatically detects support or resistance zone for potential trend reversal or continuation. It identifies the support/resistance zones from daily, weekly, and monthly candlesticks using market open, close, highs, and lows of the price.
The indicator is one of the best technical analysis tools for identifying market reversal zones or breakout out for buy and sell entries. It can be used as a stand-alone tool to identify optimal zones for buy/sell opportunities or exit. However, it is recommended to be used along with price action/other technical analysis tools for better trading results.
Furthermore, the indicator can be used in identifying short/medium, or long-term trading opportunities because it detects the support and resistance zones of the price across multiple timeframes. This feature makes it ideal for scalpers, day/intraday, and swing traders. However, traders are advised to look for trading opportunities on the H1, H4, and D1 timeframes for better results.
How to Trade with the Candle SnR Indicator for MT4
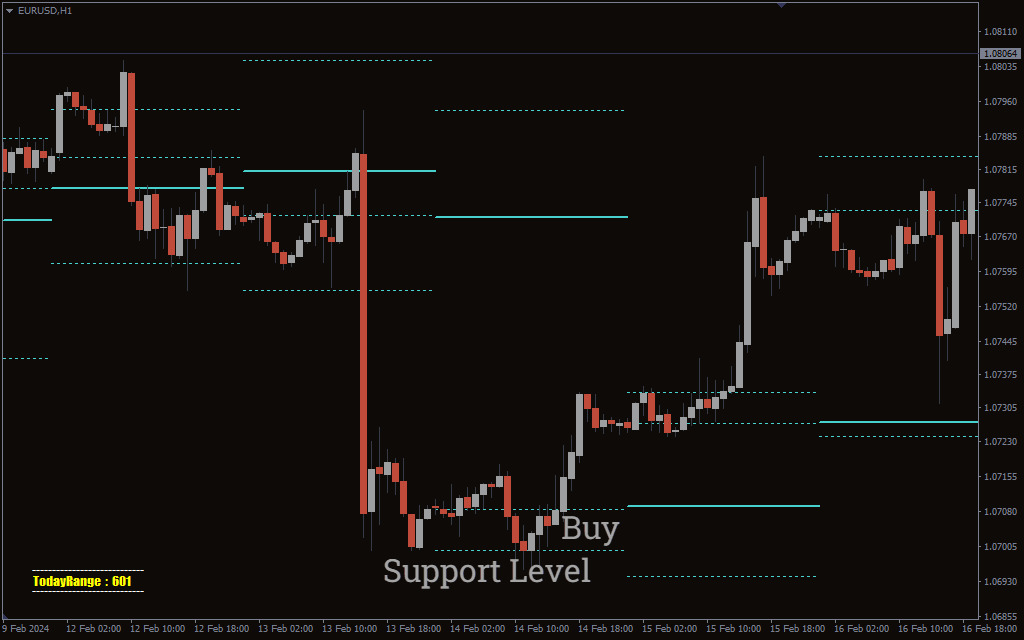
The Candle SnR indicator for MT4 highlights the support and resistance levels with horizontal lines colored in medium turquoise. The thick horizontal lines are the support and resistance levels from the open zones of the price, while the dotted lines depict zones from the highs/lows and close of the price.
As stated above, the indicator identifies potential trend-reversal zones for buying or selling opportunities. So, for example, to identify a high-probability buy setup, wait for price reactions (wicks) at the support level identified by the indicator. You may then open a buy position when the price prints a bullish candlestick pattern (e.g., bullish engulfing, hammer, etc.). Besides, you can use the Candle SnR indicator along with other technical indicators to find a buy entry.
Furthermore, you can also use the indicator to identify trend breakouts for potential buying or selling opportunities. For example, to identify a high-probability sell setup, wait for the price to break below the identified support zone and retest it. You may then open a sell position when the price action confirms the potential move with a bearish candlestick pattern (e.g., bearish engulfing candlestick, inverted hammer, etc.
Finally, the Stop loss order is recommended to be set below or above the candlesticks of the support/resistance zones accordingly, while Take Profit may be at 1:2 based on the Stop Loss pips.
Conclusion
The Candle SnR indicator for MT4 automatically plots support and resistance zones on the chart using past data from open, close, highs, and lows of the price across multiple timeframes. The indicator can be combined with price action/other indicators to make better trading decisions, which can improve the overall trading performance of traders.