

Bollinger Bandwidth Indicator
Bollinger bandwidth indicator for MT4 measures volatility and helps forex traders to anticipate big price moves.
Description
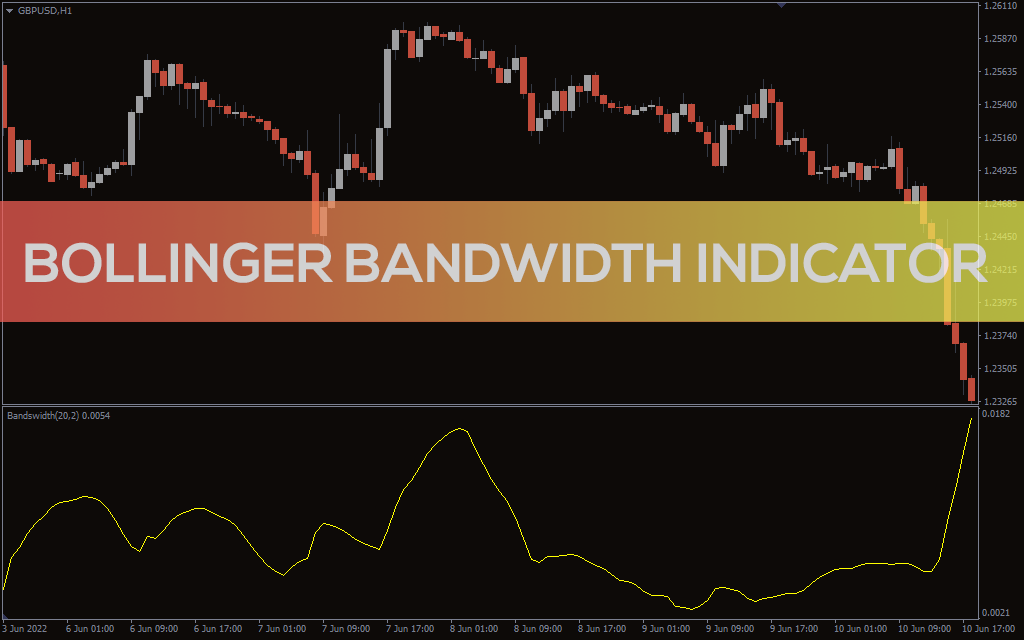
The Bollinger bandwidth indicator for MT4 measures the difference between the outer bands of the classic Bollinger bands indicator. The width of the Bollinger bands increases when the price is volatile and shrinks when the volatility is low. As a result, the Bollinger bandwidth indicator also increases in its value during high volatility and decreases during low volatility. Generally, the indicator is plotted in a separate indicator window as an oscillator.
If the Bollinger bands contract it indicates an impending volatile price move. Similarly, if the Bollinger bandwidth indicator decreases and stays flat, it indicates an impending price move. So, forex traders can look to buy or sell according to bullish or bearish market conditions.
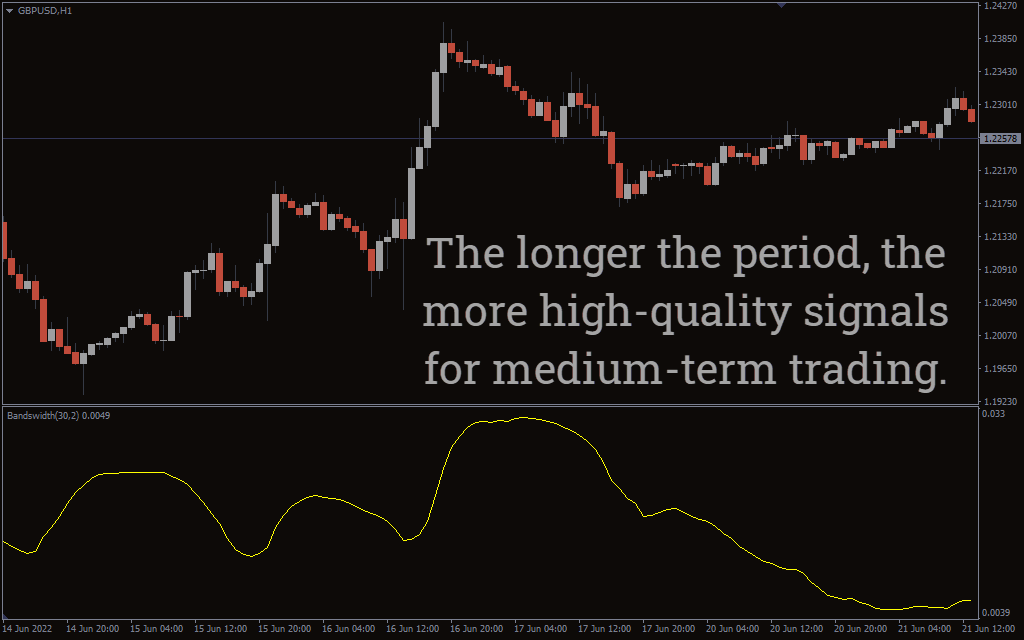
The indicator works well in all intraday price charts as well as daily, weekly, and monthly price charts. Thus, it enables swing traders and scalpers to trade using this indicator. Moreover, new and advanced forex traders can use the indicator. Forex traders should note that the indicator does not provide market direction but alerts about an impending market movement. So, new forex traders should use other indicators for confirmation of trend direction.
Bollinger Bandwidth Indicator For MT4 Trade Setup
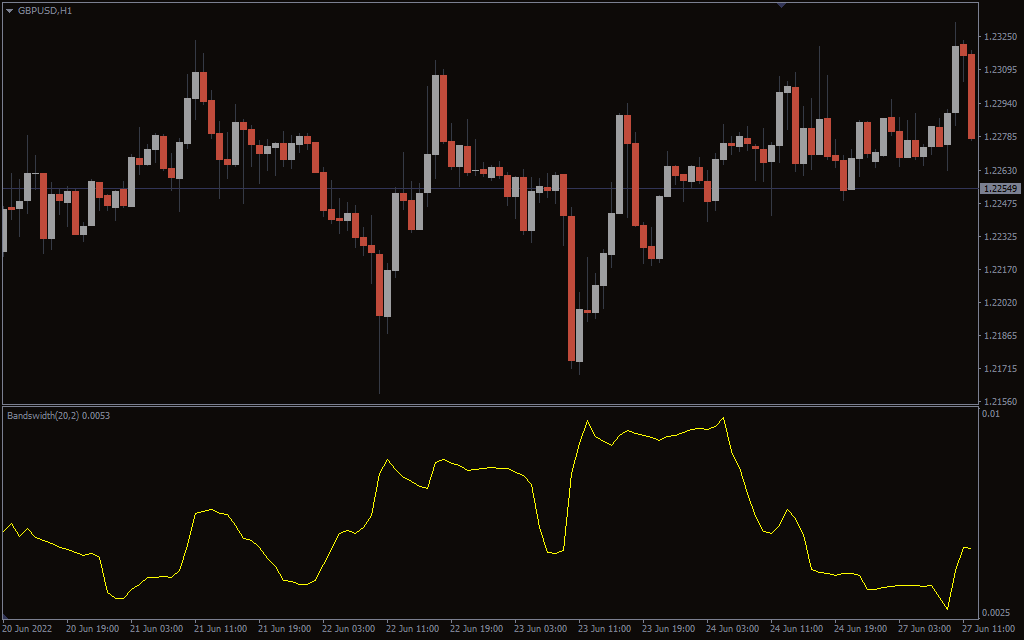
The above GBPUSD H1 price chart shows the Bollinger bandwidth indicator for MT4 in action. The indicator plots the values as an oscillator with a yellow line.
The Bollinger bandwidth helps to anticipate market volatility. John Bollinger suggests that after a period of low volatility, prices will move considerably. So, if traders identify a period of lower oscillator values, it indicates that markets are looking for a direction to make the next big move. Traders should use price action to confirm the direction of market movement and trade along the market’s direction.
The next method is to identify patterns like double bottom or double tops in the oscillator. If a double top is identified, forex traders can enter a sell position with a stop loss above the top. Similarly, if a double bottom is identified, traders can place a buy trade. The indicator does not provide a profit target, so traders should exit based on the risk and reward ratio.
Another trading strategy is to look for divergence on the oscillator window and anticipate price moves. Though forex traders can plot trend lines on the oscillator line, the break of these trend lines does not provide market direction. However, these lines can identify if the volatility is decreasing or increasing. Increasing volatility always presents trading opportunities.
Conclusion
The Bollinger bandwidth indicator for MT4 supports the forex traders using the classic Bollinger bands indicator by providing a measure of volatility. However, traders should note that the indicator does not provide trading signals or trend direction. Additionally, traders can download the indicator for free and install it easily.