

Better HMA Trend Indicator
Forex BUY and SELL signals from the best Better HMA Trend Indicator. Find out the trend’s direction through Hull Moving Average.
Description
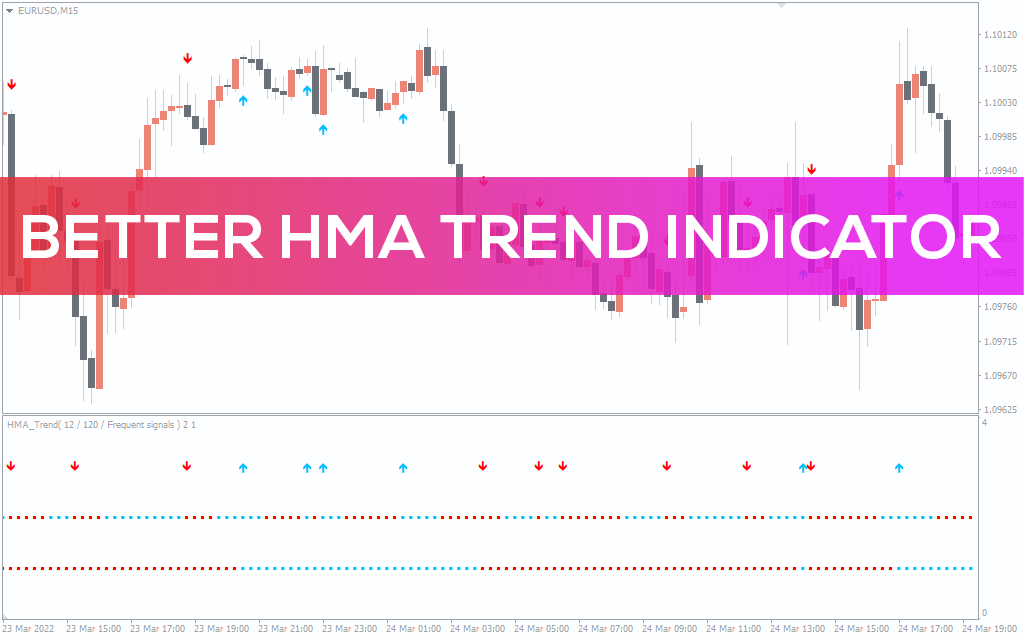
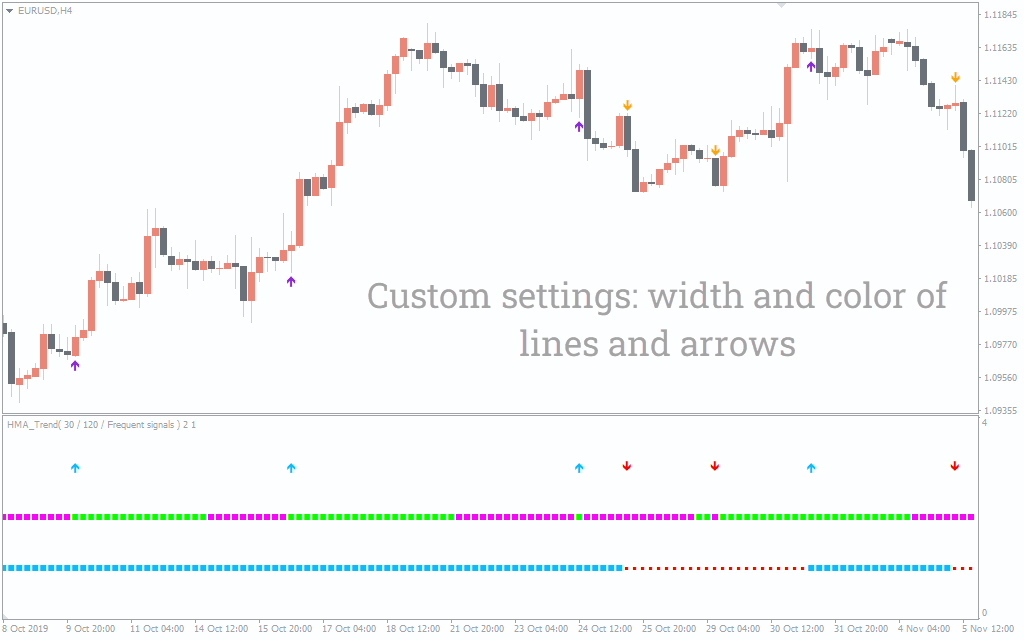
The Better HMA Trend Indicator is an MT4 indicator that plots arrows and dots to determine the trend’s direction. The indicator applies the traditional Hull Moving Average, which locates market reversals. The Indicator plots red and blue arrows on the bottom of the chart. These arrows mention the trend continuation or reversal. It also draws fast and slow dotted lines below these arrows.
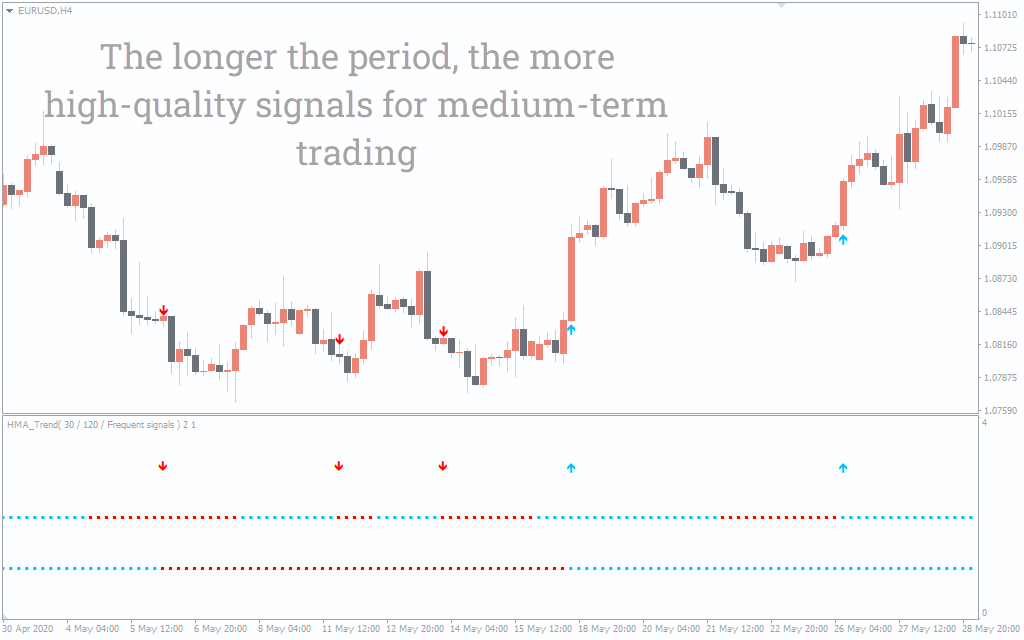
The Indicator works best on higher timeframes as it can produce false signals on shorter timeframes.
Better HMA Trend Indicator BUY/SELL signals
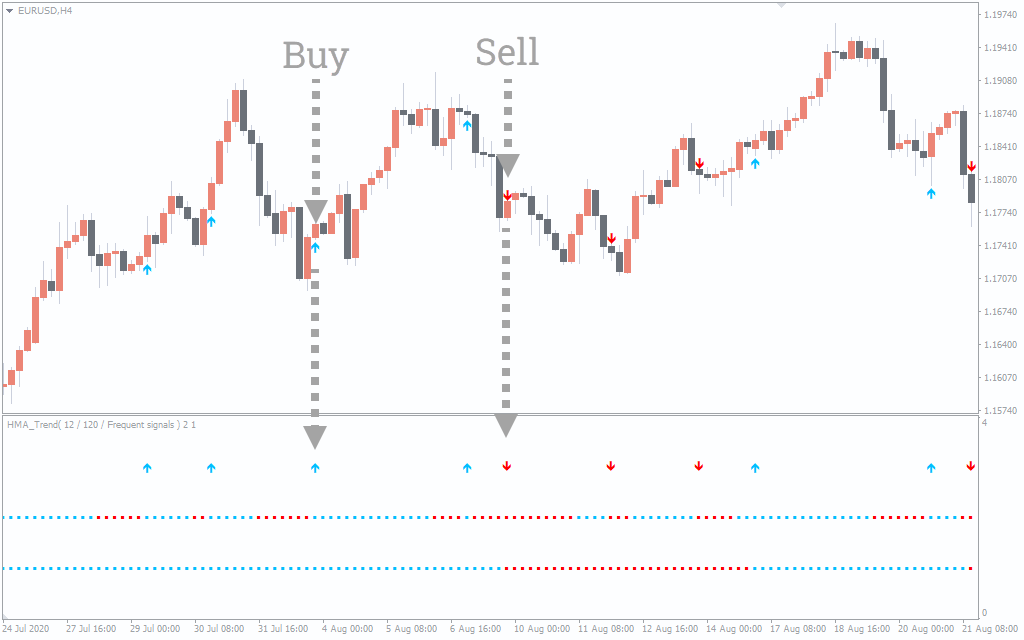
The above EUR/USD H4 chart shows BUY and SELL signals. To indicator makes it easier to find entry and exit points. When the blue arrow appears, it suggests an upcoming uptrend. On the other hand, when the red arrow pops up, it suggest an upcoming downtrend.
Traders need to wait for the price action to continue in either direction and then enter the trade.
Conclusion
The Better HMA Trend Indicator plots arrows and the traditional HMA to tell about the market trend. The indicator pinpoints exact BUY and SELL signals. In addition, you can download the indicator for free on our website.