

Auto Fibonacci Retracement Indicator
An excellent tool for plotting Fibonacci levels easily. Free download. A suitable indicator for perfect trade entry and exits points.
Description
One of the handy tools for technical analysis is a Fibonacci retracement. If you are not familiar with Fibonacci retracement, do not fret. Essentially, the tool uses a Fibonacci sequence which includes 0,1,1,2,3,5,8, 13 and so on. When you divide the Fibonacci numbers with the adjacent numbers, you get the Fibonacci ratios. The Fibonacci retracement tool plots these ratios on the price chart. Essentially, you have to identify the highs and the lows of the chart before plotting the indicator. Well, identifying the highs and actually plotting the chart can be a taxing task. Needless to say, you are susceptible to making mistakes, especially if you are not conversant with the indicator. Luckily, we have the Auto Fibonacci Retracement indicator for Mt4 – download free.
If you’re looking for more tools like this, I highly recommend checking out the Elliott Fibonacci Indicator and the KISS Auto Fib Indicator, which bring their own twist to fib-based technical analysis.
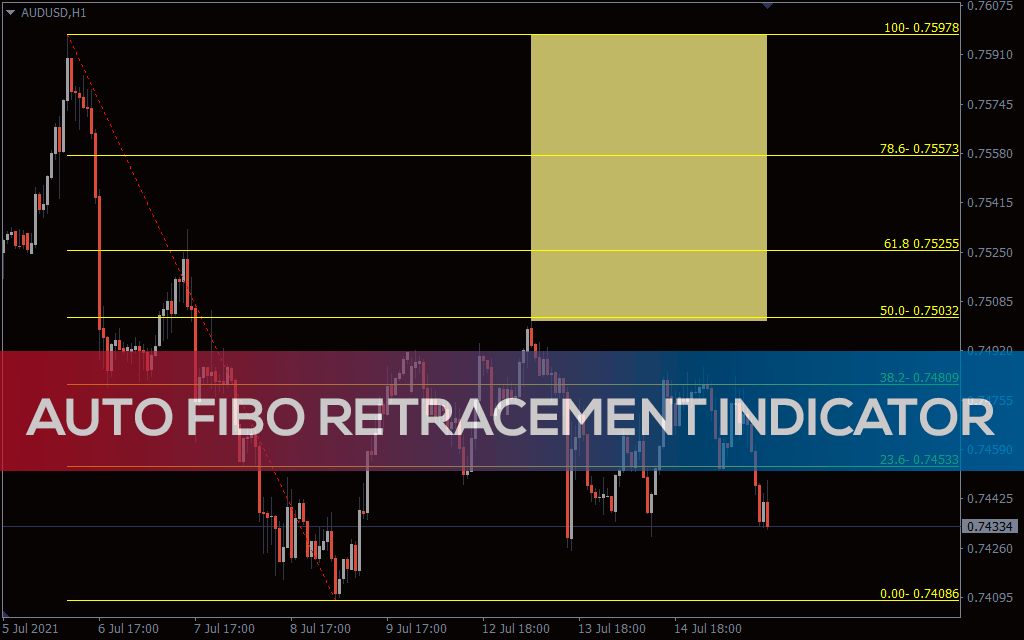
As the name implies, the indicator plots the indicator on the chart automatically. It identifies the high and the low of the chart for you. This means you do not have to set the two points explicitly.
The best part is that, the auto Fibonacci indicator can be used in all time frames and currency pairs.
How the Auto Fibonacci Retracement indicator works
The auto Fibonacci plots the retracement levels between 0 and 100%. If the market is bearish, the zero is at the top and 100 points at the bottom and vice versa. Essentially, after reaching a new high, the market tends to retrace up to the various Fibonacci retracement level.
Let assume an uptrend is expected to retrace up to 38.2% Fibonacci level. Simply wait for the market to pull back up to market 38.2% and place a buy position. You can place the stop loss below the swing low or below 50% Fibonacci level. For the exit strategy, you can place the take profit at the next high or resistance level.
From my own testing, this indicator worked great right out of the box — no manual setup required. Once installed, it instantly recognized the swing highs and lows on my USDJPY M30 chart. I didn’t need to manually stretch or correct the zones, which is a common issue with hand-drawn fibs. The way it adapted to each new impulse leg was impressive, and I found myself relying on the 61.8% and 78.6% levels more confidently than before.
In many cases, the price moves up to 50% Fibonacci level. However, 61.8% is endeared to most by traders because it offers massive pullback. The 78.6% level also provides an excellent reversal point, albeit highly overlooked.
Besides trading pullback, the Fibonacci levels offer great take-profit levels when riding the trend. For instance, if an uptrend is retracing, you can open a short position with take-profit at the 68.1% level.
A Chart Example Auto Fibonacci Retracement indicator
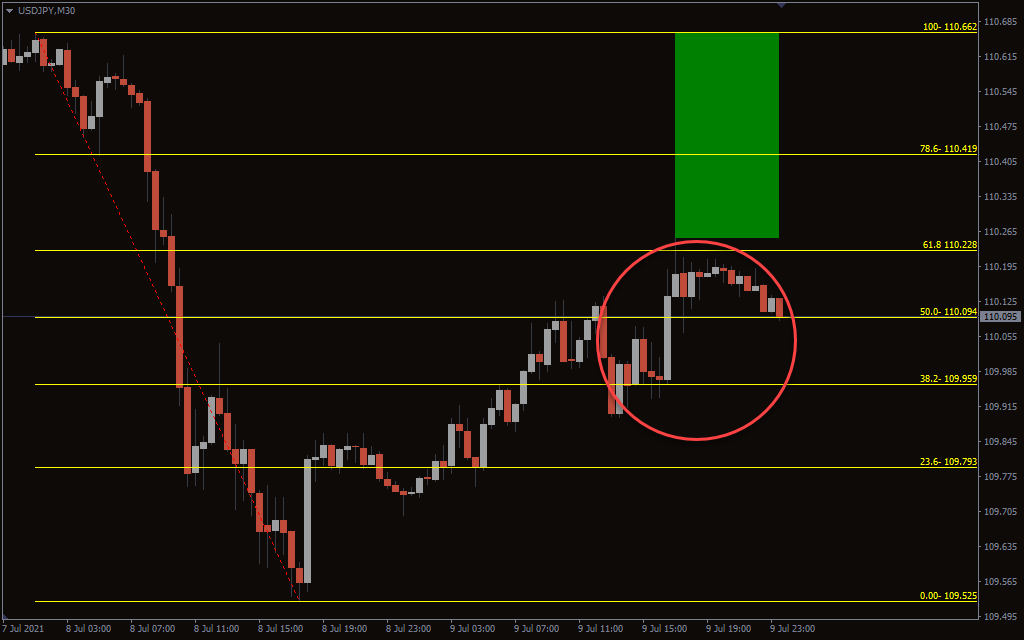
The chart above shows the price movement for U.S. dollar against the Japanese Yen in 30 minutes time frame. The currency pair price retracement goes past 38.2% and 50% levels. However, when it reaches the 61.8%, the price pulls back to the 38.6% level, before resuming the bullish trend.
Depending on your trading analysis, you can enter a downtrend with stop loss above the recent swing high. Ideal exits points are 78.6% level or 100% Fibonacci level, coinciding with the next support zone. Some traders also use Fibonacci expansion to take profits.
Pros and Cons of the Auto Fibonacci Retracement Indicator
 Pros
Pros
- Automatically identifies highs and lows.
- No need to manually draw Fibonacci levels.
- Works across all timeframes and currency pairs.
- Ideal for trend continuation and pullback trading.
- Beginner-friendly with minimal setup.
- Supports dynamic real-time updates.
 Cons
Cons
- Doesn’t provide explicit buy/sell signals.
- Can become cluttered if multiple fib zones are active.
- Requires confluence with other tools for best results.
Conclusion
The Auto Fibonacci Retracement indicator enables technical trades to plot the Fibonacci levels with ease. The indicator does not provide the entry and exit signal by itself. However, the Fibonacci levels provide excellent entry and exit points. Therefore, it is advisable to use the indicator in combination with other tools to establish confluence.
In my own experience, it’s an efficient time-saver and a confidence booster. Whether you’re catching a pullback or timing your exits, having these levels automatically on your chart frees up mental space so you can focus on decision-making, not chart drawing.
Frequently Asked Questions (FAQ)
 Does this indicator work on MT5?
Currently, this version is for MT4, but we also have the exact same one for MT5.
 Does it repaint or redraw past levels?
No, once a fib level is plotted based on confirmed highs/lows, it stays fixed until a new structure is formed.
 Can I customize the Fibonacci levels?
This version comes with preset standard levels, but depending on the build, some may allow basic customization via indicator settings.
 Can I combine it with price action strategies?