

ADX Channel Indicator
ADX channel is an ideal tool for identifying the trend.
Description
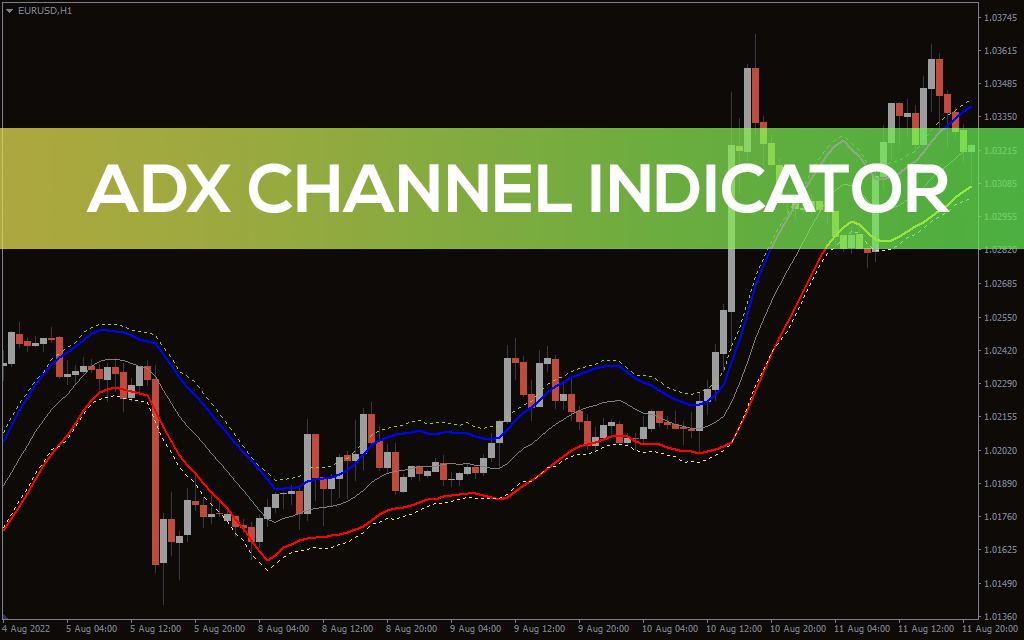
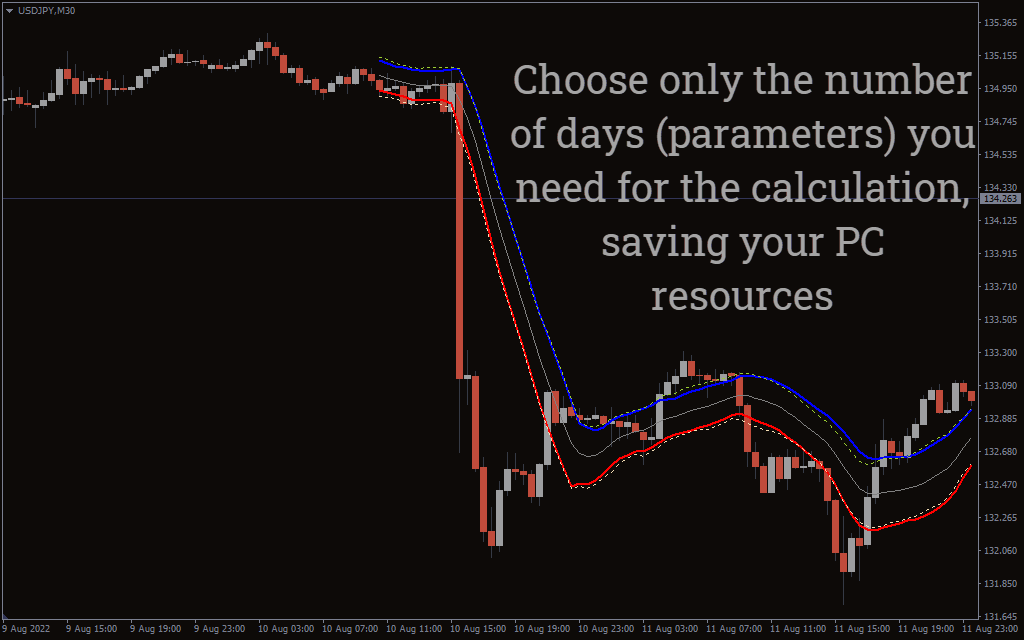
As the name suggests, the indicator depends on the average directional trend index value (ADX) values to create a channel. The channel varies depending on the market volatility but gives buy and sell signals when the price action touches the upper and lower indicator line. The indicator works well on the lower timeframes of 5 min to1-hour timeframes. ADX Channel Indicator does not work well on the timeframes above the daily timeframe and during news events.
How To Use the Indicator
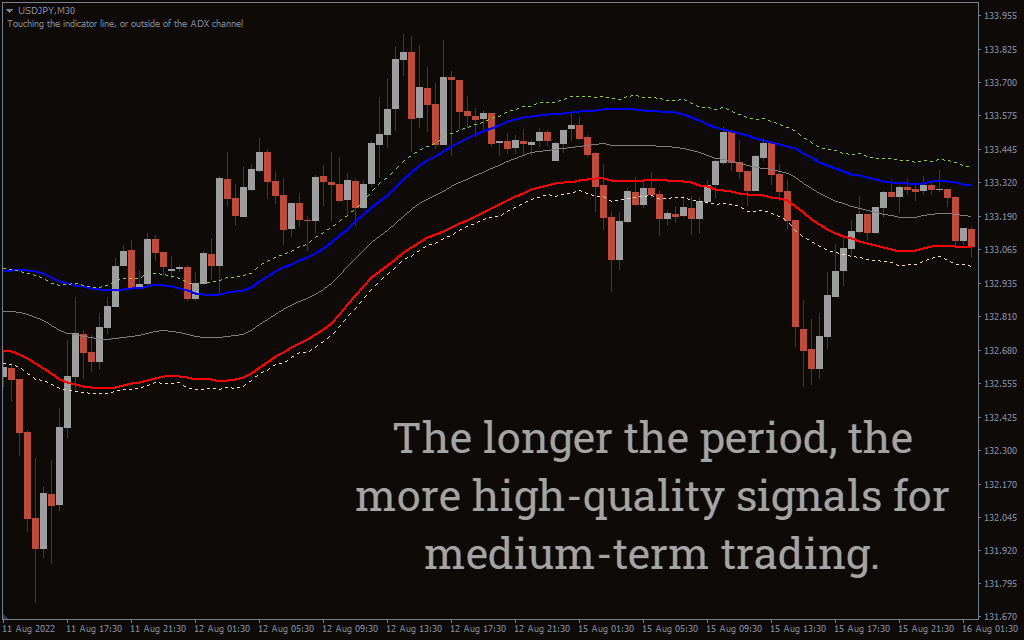
The indicator creates an envelope. You want to enter buy and sell positions when the price action touches the indicator line. In Addition, it plots a dotted line using the DI and DI- values of the ADX indicator. This acts as suitable stop loss levels.
- Buy when the price action touches the lower line and bounces upwards.
- Open a sell signal when the indicator touches the lower line and bounces downwards.
ADX Channel Trading Example
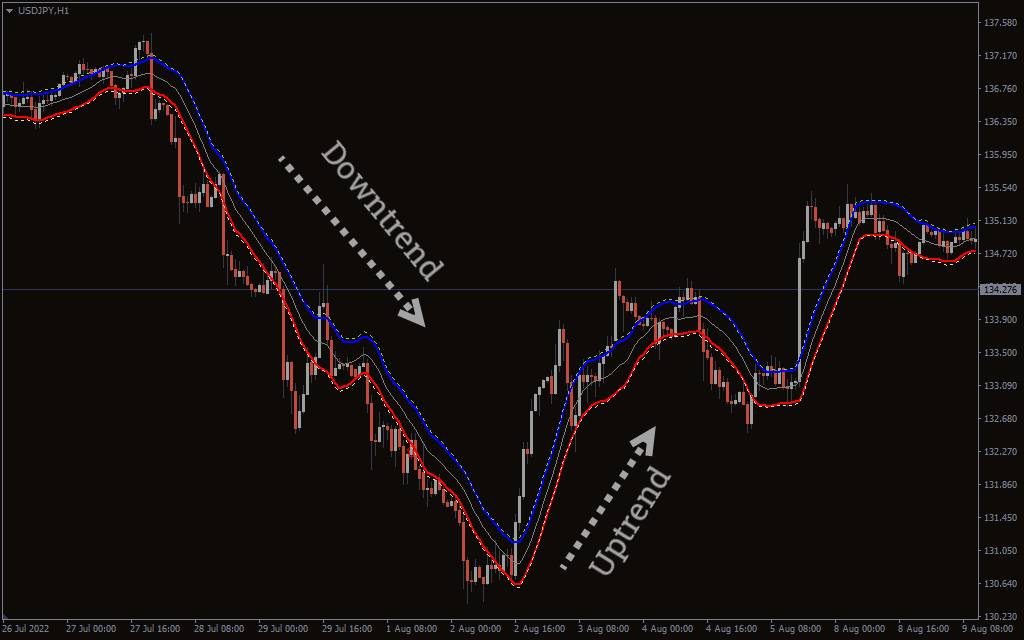
The indicator shows the price movement of the US dollar against the Japanese yen in a one-hour timeframe. The channel of the cloud indicator follows the trend smoothly. During the bullish market, it moves upwards below the price action. However, the cloud crosses above the price actions during a bearish market and trends downwards.
Conclusion
The ADX channel is one of the best indicators for identifying the trend. It plots a cloud-like structure that appears above or below the price action depending on the existing trend. It is one of the trends trading tools you should have.