123 Forex Patterns Indicator
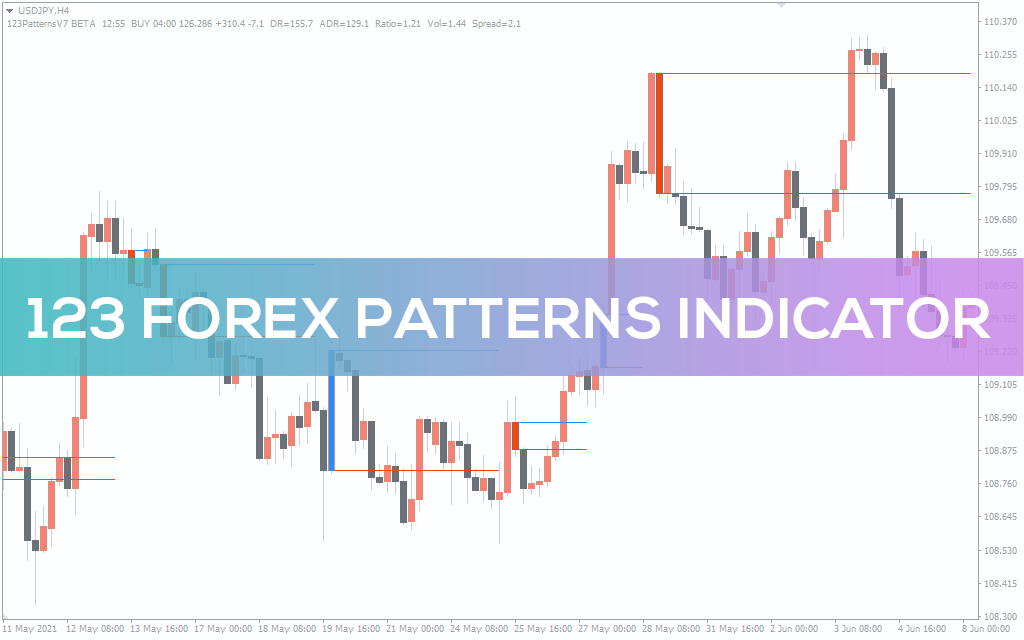
123 Forex Patterns is a trend-following MT4 trading indicator. Identifies bullish & bearish trend reversals patterns. Points precise buy-sell positions in live markets.
Description
123 Forex Patterns identifies potential trend reversal positions of the price. Besides forex, it also helps stock and cryptocurrency traders anticipate solid buy-sell zones.
Trend-following traders find it ideal for placing orders around the pullback areas of the market as it helps them target a better profit margin. If you are a beginner in pattern-based trading, then the 123 Forex Pattern can be an excellent indicator to start.
Technically, the 123 pattern strategy suits both scalping and intraday trading. Once you install it in your Metatrader 4 platform, you can start monitoring the trend changes on MTF charts. We’ve found this indicator performs best within hourly to daily timeframes.
This guide explains how to identify key trend-reversal positions using the 123 Forex Patterns indicator, including its MT4 settings.
What is the 123 pattern in forex?
The 123 pattern represents a three-wave price formation that portrays the reversal or continuation patterns of the market trend. It identifies bullish and bearish chart patterns helping forex traders engage in buy-sell activities during crucial price reversal conditions. While testing 123 Forex Patterns, we’ve found the indicator suits all types of currency pair’s charts available within the MT4 platform.
How to assess market trends and buy/sell positions using the 123 Forex Patterns Indicator in MT4?
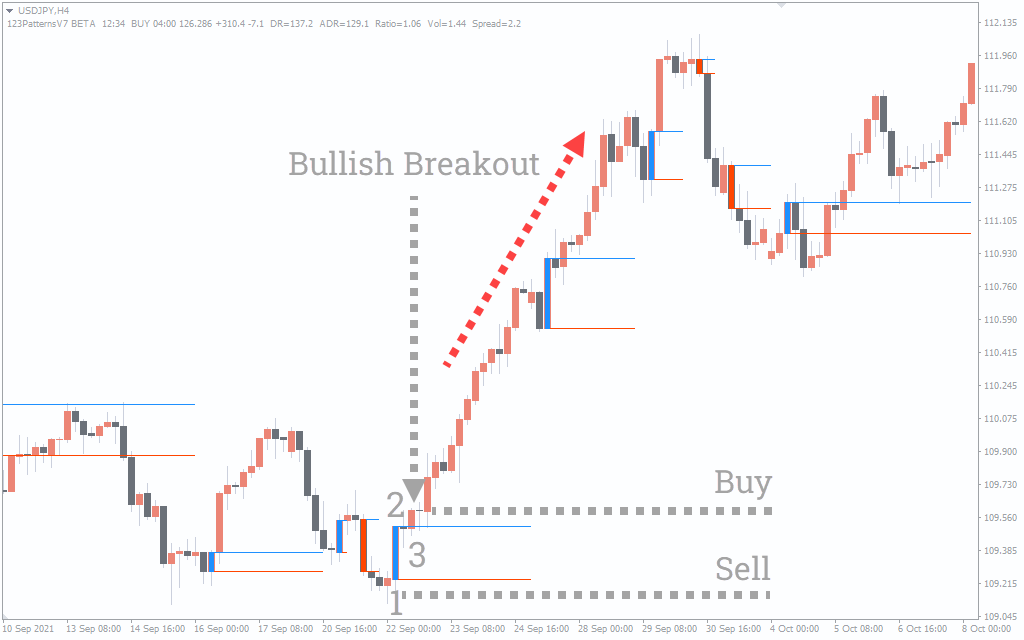
The 123 Forex Patterns target significant price movements around the daily market highs and lows to detect trend continuation/reversal patterns. Like the above example, the indicator highlighted the large bullish candle at the bottom of the chart as a potential formation of 123 patterns.
The low of the bullish candle (1) is the starting point of the reversal pattern. The high of the respective candle signifies the maximum price movement range from the starting point. Since the indicator marks the candle with blue color and the initial movement is bullish, we’ll consider it a potential bullish price pattern.
After the price makes the first movement, we’ll wait for a retracement like the above example (3). We can open a buy order when the price moves above the high of the blue candle (2) after completing the retracement. Conversely, the price breaking the low of a red candle can be an ideal position for triggering a sell entry.
Conclusion
The 123 Forex Patterns is the best MT4 indicator for identifying highly probable trend-following trade setups based on recent price actions. This tool makes it easier to recognize key chart patterns and, at the same time, shows key price levels. We recommend the 123 Forex Patterns, a super choice for beginner-level technical traders, as a free MetaTrader 4 indicator.